AXEHEDGE

Stock Chart Trading: Piercing Candlestick

How to trade with a Piercing Candlestick pattern?

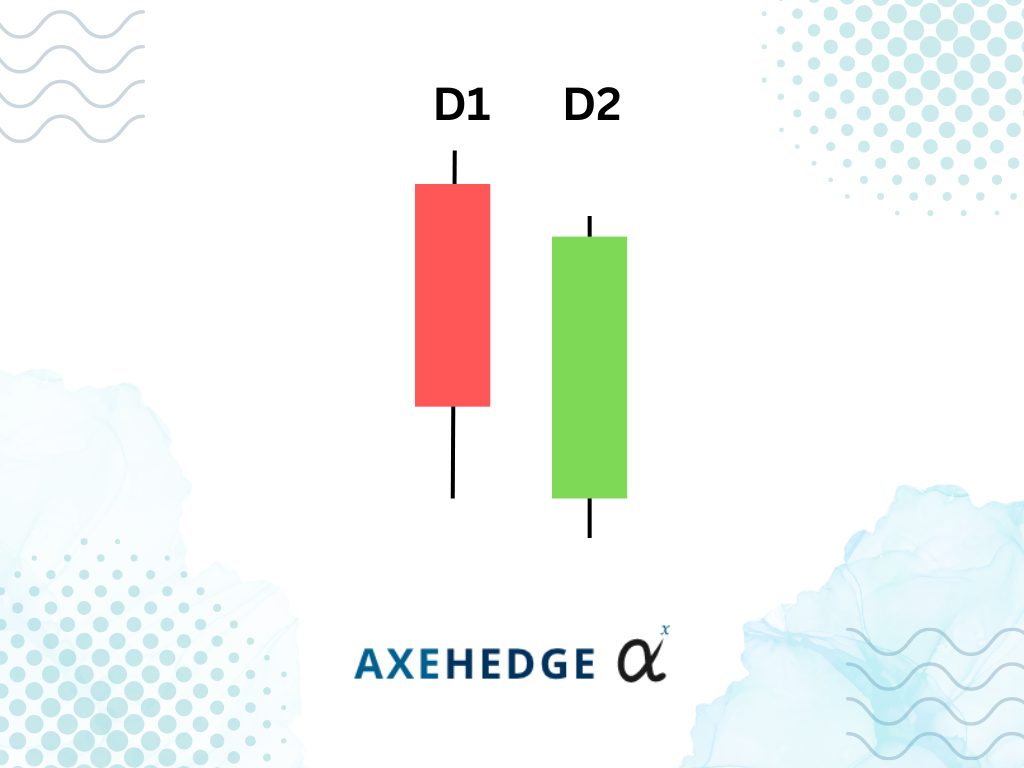
The piercing candlestick is pretty much just like the Bullish Engulfing Candlestick, whereby for you to trade, you’ll need to see the pattern forms within two trading days. It is also nearly similar to the Bullish engulfing candlestick in the sense that the massive size of the candlestick on the second trading day (D2) sort of ‘swallowed’ the candlestick on the first day (D1) — but for piercing, it doesn’t swallow it whole.

Just in case you haven’t yet mastered the different types of price charts available, check out our article below!

Stock Chart Basics for Beginners

Characteristics of The Piercing Candlestick

Here’s how to know if it’s a piercing candlestick pattern:

  • It appears in a downtrend.
  • The first day (D1) candle is red, while the second day (D2) candle is green.
  • The D2 opening price (the lower part of the green candle body) is below the closing price of D1 (the lower part of the red candle body).
  • D2 closing price jumps to near D1’s opening price.
  • The D2 candle body overshadows the D1 candle body by not less than 50%, but not until 100%. So, if the range of the red candle body is 10, the green candle body must be somewhere between 5 to 9.

What does the piercing candle tell you?

Here are the things that you can tell about the market sentiment when the piercing candlestick appears:

    • It appears in a downtrend, so the current mood of the market is bearish, people are selling more than they are buying, thus driving the price down.
    • The D1 candle is red, showing that the trend continues to go down.
    • The D2 opening price sets a new low for the trend, showing that people are selling it so much that it went down badly.
    • However, D2’s closing price suddenly jumps high, almost surpassing D1’s opening price. It shows that the price is so low the mood has changed, people are now buying more and more, driving the price up for D2.
    • Since the mood has changed, there is a chance that even the trend will shift from a bear market to a bull market.

How to trade?

Risky:


If you’re a risk-taker, what you can do is buy at D2’s closing price (when the market nears closing time). However, be sure to observe these two conditions — first, the price nearing the close of D2 is higher than 50% of D2’s body; and second, D2 opens lower or nearly the same as D1’s closing price.

You can put your stop loss at whichever point is the lowest point that the price moved to within the two days (not open or close price). Say, if the bottom tail in D1 is the lowest point at $100, then you put your stop loss at $100.


Risk Averse:


If you’re a risk-averse trader, then you might want to wait until it’s near the closing time of the next day (the third day) to see if the price on the third day is in fact bullish. If it is, then you might want to buy it before the market closes.

Just like when going risky, you can put your stop loss at whichever point is the lowest point that the price moved to within the two days (not open or close price). Say, if the bottom tail in D1 is the lowest point at $100, then you put your stop loss at $100.

However, given that you’re buying on the third day, you might want to brace to buy at a price way higher compared to if you bought on the second day (D2).

Bottom line

  • The piercing candlestick indicates a change in market sentiment from bearish to bullish.
  • The strong buy sentiment managed to drive the price up.
  • The pattern will often occur within two consecutive periods (usually days) in the market.
  • It’s identified by the second day as a green candlestick that opens lower than the first day’s red candlestick but managed to close near to the first day’s market open price.
  • Slight variation in price is negligible but be sure that small really means small ($0.20 out of a dollar isn’t small).
  • A risk-taking trader would buy on D2, meanwhile, a risk-averse trader would buy at D3 (but at a higher price).

Do keep an eye out for our posts by subscribing to our channel and social media.

None of the material above or on our website is to be construed as a solicitation, recommendation or offer to buy or sell any security, financial product or instrument. Investors should carefully consider if the security and/or product is suitable for them in view of their entire investment portfolio. All investing involves risks, including the possible loss of money invested, and past performance does not guarantee future performance.

Written By

Become a AXEHEDGE investor today.