
The second triangle: the Descending Triangle
Read More
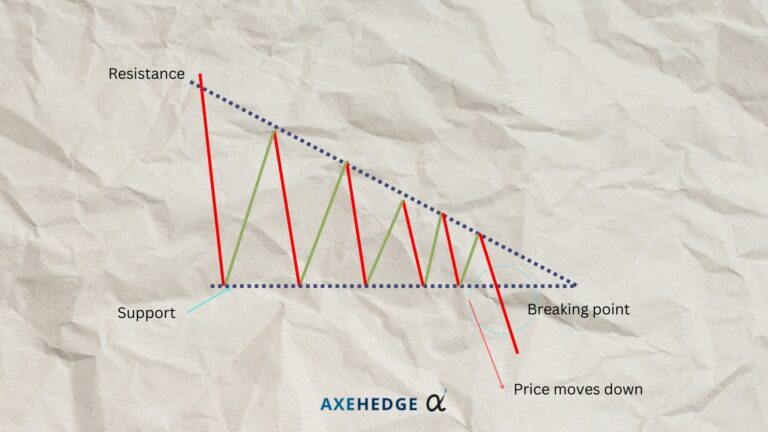

Confirmation: Sometimes, after breaking out, the price may retest the support level, which now acts as resistance. A bounce off this level can serve as a confirmation of the bearish trend.
In the example above, it’s a 50–50 ish example of how the triangle trade was confirmed, because if you see, just two days after the breakout, the price went right above the breakout line and stays there for a while.
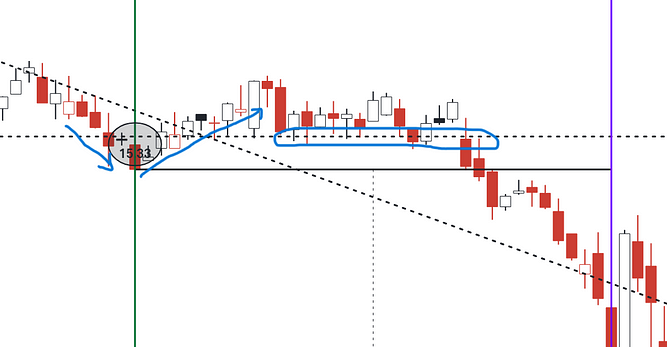
Some traders would place their short right away and wait until stop loss is hit before they pull out, some would wait further — whereby if we’re talking about the example above, they might not enter into this trade, which is okay as well.
Set a Price Target: Traders often set a price target by measuring the height of the back of the triangle and then subtracting that amount from the point of the breakout.
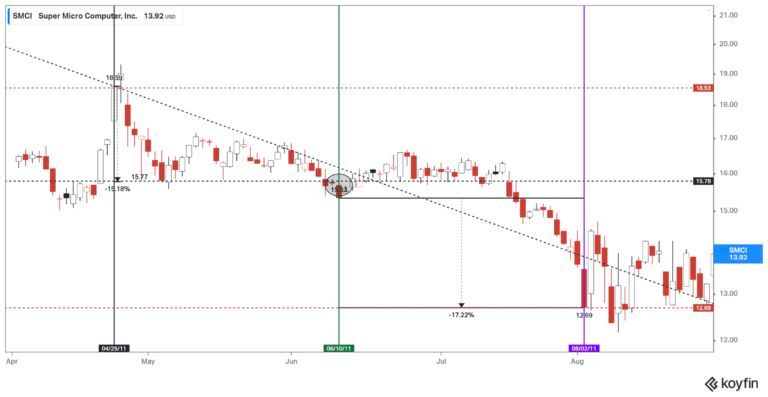
In our example above, we can see that the price difference at the back of the triangle is around 15%.
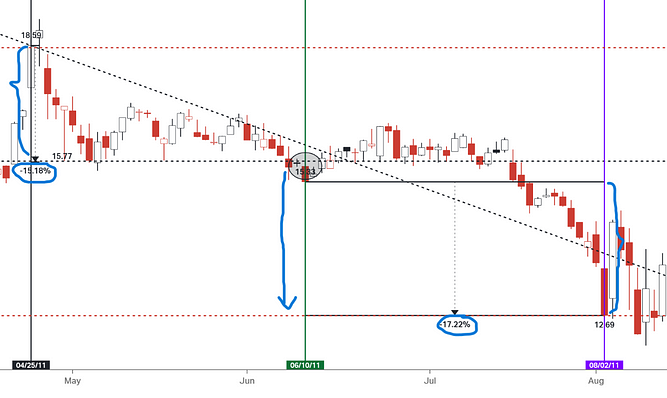
So, your appropriate target for profit-taking should be somewhere around 15%, lower than 15% if you’re more on the safe side, and more than 15% if you want to play it riskier.
In this case, we manage to reach 15% and even more at August 2nd, 2011.
Set stop loss: The stop loss for a short position is usually placed somewhere around the top part at the beginning of the triangle. In the example we had, it would be somewhere around $18.53.
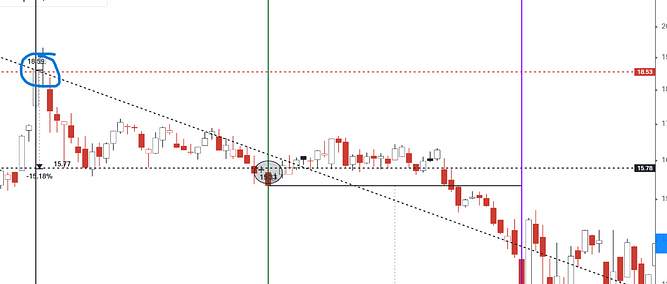
If you’re playing it safe, you can place it a below $18.53. If you’re taking more risk, you can place it a bit higher than that. How much is “a bit”? That would depend on your personal preferences.

5 Common Mistakes Beginner Traders Make
Things to avoid when you’re just starting to trade
Read More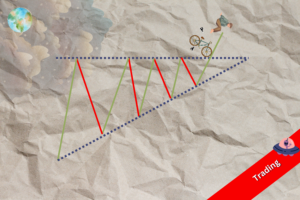
Trading Dow Pattern the Triangle Pattern (Part 1)
The first triangle: the Ascending Triangle
Read More
Funds: Equity Funds (Part 3)
How to choose between equity funds based on companies’ earnings...
Read More