
The second triangle: the Descending Triangle
Read More


Long Position:
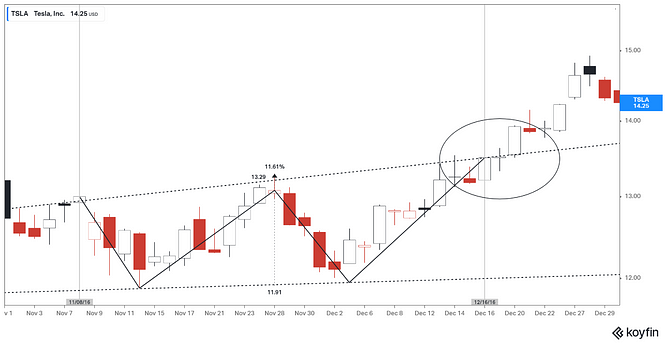
Traders typically enter a long (buy) position when the price breaks above the neckline, confirming the completion of the double bottom formation and signaling a potential trend reversal. This is when you place your buy. Some traders may wait for a pullback or a retest of the breakout level before entering to ensure that the breakout is valid.
Just in case things don’t work out, where do you place your stop loss? You’d usually want to put your stop loss just a bit below the second trough.
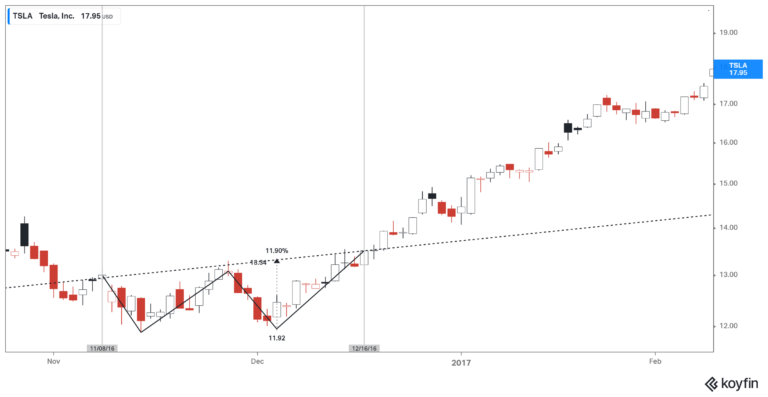
Where can you start taking profit? The key is to draw a line vertically to measure the distance between the neckline and the height of the two valleys.
In this case we can see that the distance between the two price levels is at around 11.6%. So, if you bought it at the breakthrough price, which is $13.92, then 11.6% of that would be around $15.54.
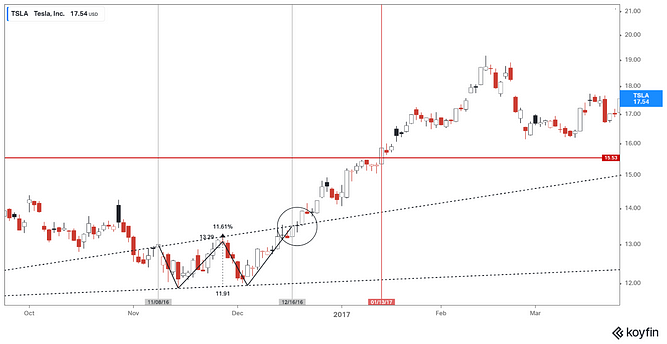
In this case, you’d be holding for shy than a month before taking profit.
Additional notes:
- This trend and double top trend would usually occur within a period of at least 28 days, or around 2 weeks for each valley/mountain (because they look like two mountains).
- Pay attention to trading volume. A breakout with higher-than-average volume can provide additional confirmation of the pattern’s strength. Volume should ideally increase during the breakout, signaling increased buying interest.
- Assess the risk-reward ratio before entering the trade. Ensure that the potential reward justifies the risk taken.

5 Common Mistakes Beginner Traders Make
Things to avoid when you’re just starting to trade
Read More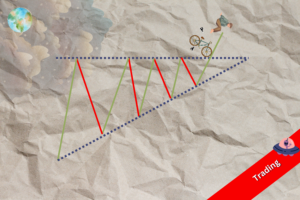
Trading Dow Pattern the Triangle Pattern (Part 1)
The first triangle: the Ascending Triangle
Read More
Funds: Equity Funds (Part 3)
How to choose between equity funds based on companies’ earnings...
Read More