The hammer candlestick pattern is a type of candlestick formation that is widely used by traders in deciding when and where to place their buys and sells. In short, when the hammer pattern appears in your chart, it shows that there is a possibility that a downtrend might be going for a reversal (going bullish). How does it work?
Before we proceed, if you have absolutely no idea how the price charts work in trading (stocks, forex, etc.), check out our article below!
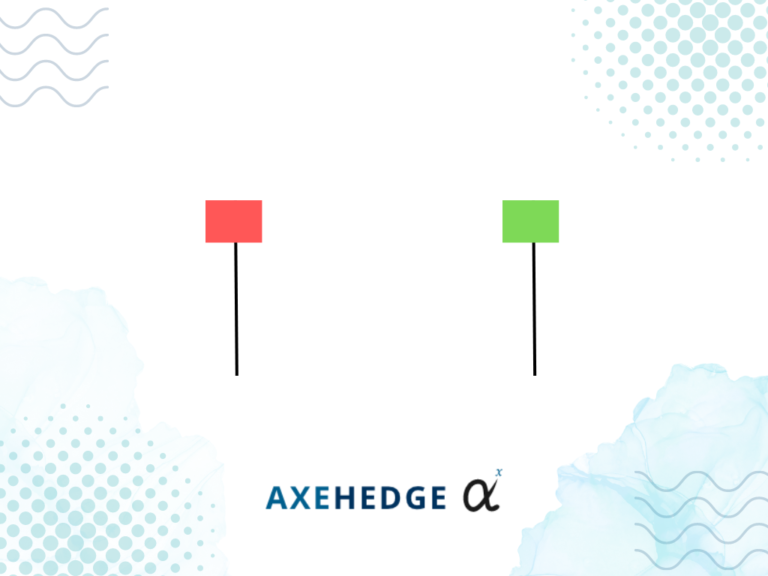
Here are a few of the notable things that indicates if it’s a hammer pattern or not:
It looks like an upright hammer
Yes, we know, it’s obvious from the name, how else would a hammer pattern looks if not like a hammer? However, in this particular situation, we are just talking about the upright-looking hammer. A hammer in which the head of the hammer is on the top. So, a hammer candlestick here refers to a candlestick with its body at the top, and a long tail at the bottom of it.
It doesn’t matter if the body is green or red.
Also, there is a pattern called the inverted hammer, which is an upside-down version of what we’re going to talk about today, but that will be for another article.
The tail is twice the body
In a hammer candlestick, the length of the tail must at least be twice the ‘size’ of the body. For example, in the image below, we can see that the bottom part of the body is $2 while the top part of it is $2.5. The difference is $0.5.
As for the tail from the image above, we can see that the difference between the top-bottom tail price is $1. So, the size of the body is $0.5, while the size of the tail is $1. So, $1 is twice $0.5, and it fulfills the criteria to be considered a hammer.
Note: there can be a little bit of tail above the hammer’s body, as long as it’s too small to be notable. The range of the body size is usually around 1% to 2% apart.
Hammer pattern only at the bottom of a downtrend
Next, the hammer pattern only appears at the bottom of a downtrend. Hammer is a sign of a bullish reversal, so it’s only canon that it appears during a downtrend. The position where it appears is usually at the bottom of a downtrend. See the image below:
“Alright the one in the image is pretty obvious, but when we live trade, how do we tell if it’s the hammer you’re talking about when we can’t even tell what the next candlestick is going to be?”
Good question, the answer will be answered shortly in our “How to Trade”.
What does the hammer trend tell you?
When the hammer candlestick pattern forms, it tells traders a few things about the sentiment of the market:
It started off with a downtrend, so the general sentiment was not so good. People are selling more than buying, hence the price drops.
However, as the price falls and falls, the hammer forms.
The long tail of a hammer shows that the price has moved down very far for the day, but the buy sentiment is somewhat very strong that they manage to push the price up to be higher than the day’s lowest price (regardless if the candle is green or red).
So, what it tells you is that there is a new sentiment in town, the bull is appearing amidst a bearish market!
TLDR; now that a new sentiment is appearing, there is a possibility that the downtrend may now change to a bullish trend.
How to trade?
There are two ways to buy when you see the hammer pattern appearing, either to play risky or to be a bit more risk-averse, but both would result in you buying it.
Risky
Those who want to take the risk can buy on the same day as the formation of the hammer, perhaps nearing when the market closes.
The risk is that there is no confirmation yet if it is indeed going to be bullish, it’s just that the earlier signs have shown up.
The perk of taking such a risk is that you get to buy it before the price is high, thus more profit for you.
You can put your stop loss below the hammer — some put it below the hammer’s head, some put it at the bottom-most part of the tail, but many also go for somewhere in between the two.
Risk Averse
Those who want to play it safe will wait until near the market closing time of the next day following the formation of the hammer. If the price is bullish on the second day, they will consider the bullish sentiment confirmed and place their buy.
The good part of being risk averse is that sometimes the hammer candlestick may form, but the trend continues to fall, so if you play it safe, you can double-check if the trend is really forming before placing your buy.
The downside of it is that you might be buying at a higher price since you wait for other people to buy it first and drive the price up before you place your buy.
You can put your stop loss below the hammer — some put it below the hammer’s head, some put it at the bottom-most part of the tail, but many also go for somewhere in between the two.
So, if you’re conscious that the hammer you’re seeing is the hammer we’re talking about here, you could try a more risk-averse approach, but if you’d take on a little more risk, then the risky method might be your cup of spiced chai latte.
Bottom line
A hammer candlestick pattern would usually indicate that a bearish market might reverse to a bullish one.
The hammer must form at the lowest part of a downtrend.
The body-to-tail ratio for the hammer to be regarded as a hammer is at least 2:1.
There can be instances where it doesn’t work, and the price may continue to fall.
Be sure to stick with your plan, don’t sell before stop loss, and don’t sell before the price reaches your goal.
Do keep an eye out for our posts by subscribing to our channel and social media.
None of the material above or on our website is to be construed as a solicitation, recommendation or offer to buy or sell any security, financial product or instrument. Investors should carefully consider if the security and/or product is suitable for them in view of their entire investment portfolio. All investing involves risks, including the possible loss of money invested, and past performance does not guarantee future performance.