AXEHEDGE

Stock Chart Trading: The Doji

Understand what a Doji pattern is to ‘Doji’ a bullet!

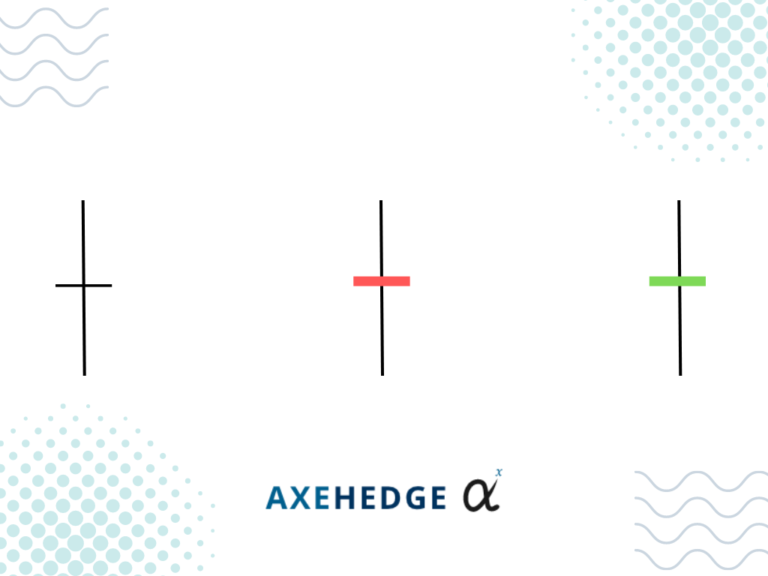
“Doji” is Japanese for “the same thing”. The reason that the pattern we are about to discuss is called Doji is that the price on the candlestick chart when it opens is pretty much the same as when it closes.

Now, if you have no idea about the different charts available when trading and what each of them indicates, this article will clear things out:

Stock Chart Basics for Beginners

What does a Doji look like?

Above are how Doji might look like. We have a Doji that opens & closes at the same price (left), opens & closes with a slight drop when closing (middle), and opens & closes with a slight increase when closing (right).

Here are a few characteristics of a Doji candlestick that you must remember:

  • The opening price and the closing price are the same, and even if they aren’t, the differences are just too small.
  • The tail length can be of any length, we just use the above as an illustration.
  • The most important part of a Doji is that its candlestick body is so thin that one can say it’s almost like Doji doesn’t have a body.
  • The color of the chart doesn’t really matter in a Doji because it’s too thin for you to even be bothered.

What does a Doji indicate?

Much like its counterpart, the spinning top pattern, a Doji indicates that the market is indecisive.

If the tails are long, you’d say that the price moved up or down remarkably for the day but ended somewhat at the same price as when it started. What does it mean? As we said, the market is indecisive. Both the bullish and bearish sentiment is not yet ready to move the price for the day, so despite all the movements, they ended in the same way.

If the tails are short, that’s even worse. The market is too indecisive, the price didn’t even bother to move as much.

Find out more about Spinning Top:

Stock Chart Trading: The Spinning Top

How do I use Doji for my trades?

If you see a Doji or Dojis forming during a certain market trend, then it can tell you how you should position yourself. Let’s look at how you should react when it happens during an uptrend or a downtrend.


Uptrend

So, here’s the information that you have from the chart:

  • The sentiment was bullish, and now it’s uncertain.
  • Bearish sentiments have entered the picture, and people are now uncertain.
  • The trend can either continue going up, or it can reverse to a downtrend.

From the information above, what you can say is now people are at a junction where they can choose whether the trend is going to continue or if it’s going to go in the opposite direction.

Here’s what you might want to do:

  • Minimize your position size in the market.
  • If you want to hold, you can hold half the amount you already have, and sell the other half while you’re still making a profit. If the trend continues, you’ll still have a stake in there, but if it reversed into a downtrend, at least you’ve made a profit from the other half you sold.
  • If you want to short the stock, allocate half the actual amount of money you want to short with. If you have $1,000, perhaps you can use just $500 for the shorting.
  • Some traders choose to just stay away from an uncertain sentiment like this.


Downtrend

So, here’s the information that you have from the chart:

  • The sentiment was bearish, and now it’s uncertain.
  • Bullish sentiments have entered the picture, and people are now unsure.
  • The trend can either continue going down, or it can reverse to a downtrend.

From the information above, what you can say is now people are at a junction where they can choose whether the trend is going to continue or if it’s going to go in the opposite direction.

Here’s what you might want to do:

  • Minimize your position size in the market.
  • If you want to buy, you can buy half of the amount you’re expecting to spend. For example, if you have $1,000 to spend, you might want to just spend $500 on it — if you win, a win is a win, but if you lose, at least it’s only 50% of the money you have.
  • If you want to sell the position you’re currently holding to cut down on the losses, you can sell half of it first, just in case the trend takes a turn for the better, at least the other half of your holdings can try to offset your loss as much as it can.
  • Some traders choose to just stay away from an uncertain sentiment like this.

Things to remember

  • A Doji isn’t always a sign of reversal in market trends. They can just continue doing what they are doing for all we know, that’s why it’s considered uncertainty in the market.
  • A Doji can appear in a cluster, or it can appear alone. Dojis are also sometimes seen forming with Spinning Top patterns.
  • A spinning top indicates confusion and indecision in market sentiment.
  • If it appears during a trend, it means that the opposite sentiment has entered the picture, but whether they will succeed or not in turning the trend another way is hanging in the balance.
  • The trend can either continue or it can reverse.
  • Minimizing your position is not a bad idea when this happens.

Do keep an eye out for our posts by subscribing to our channel and social media.

None of the material above or on our website is to be construed as a solicitation, recommendation or offer to buy or sell any security, financial product or instrument. Investors should carefully consider if the security and/or product is suitable for them in view of their entire investment portfolio. All investing involves risks, including the possible loss of money invested, and past performance does not guarantee future performance.

Written By

Become a AXEHEDGE investor today.