
The second triangle: the Descending Triangle
Read More
There are three types of triangle patterns: Ascending, Descending, and Symmetrical. In this writeup, we will just look into the Ascending Triangle. However, here are all three of them just so that you are familiar with how they look like.
Ascending
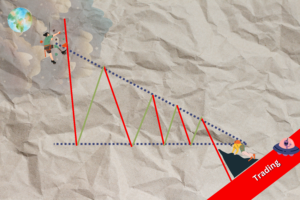
Descending:
Symmetrical:

Entry Point:
Consider entering a long (buy) position after the breakout is confirmed.
Some traders prefer to wait for a pullback or a retest of the breakout level before entering to ensure the breakout is valid.
Stop-Loss Placement:
Set a stop-loss order to manage risk. This is often placed just below the ascending trendline or the breakout point. In the graph we showed above, it should be somewhere around the red line here:
Eventually, you should put your stop-loss level based on your risk tolerance and the volatility of the stock put it a bit higher if you’re more risk averse, put it lower if you’re taking more risk.
Target Price:
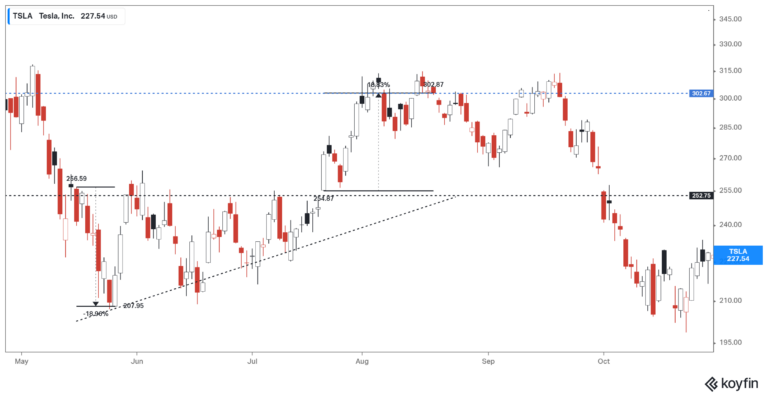
Determine a target price for taking profits. One common approach is to measure the height of the triangle and project it upward from the breakout point.
So, how you do it is measure the height (the percentage of price difference) on the left side of the triangle — in the example below it’s around 18%.
After you’ve got the number, expect an 18% increase from the breakout point (in the example above the breakout point is at ~$254, so 18% from that is 299.72.
If you’re wary of risk, then you can put it lower. As you can see from the example above, we barely make it above 18% before the number starts falling again as people are taking profit.

5 Common Mistakes Beginner Traders Make
Things to avoid when you’re just starting to trade
Read More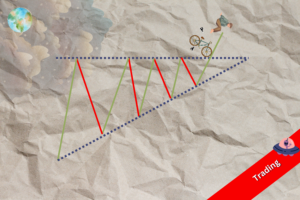
Trading Dow Pattern the Triangle Pattern (Part 1)
The first triangle: the Ascending Triangle
Read More
Funds: Equity Funds (Part 3)
How to choose between equity funds based on companies’ earnings...
Read More