AXEHEDGE

Stock Chart Trading: Marubozu

How does a single bar in a chart affect how you make money?

For those keen on day trading, Marubozu is a trading strategy considered essential for many. Marubozu is Japanese for “close-cut” or “bald” — so how can one’s hairstyle of choice (or fate) become one of the most popular trading strategies out there?

Before we start, it would be necessary for us to provide you with a trigger warning — baldness. We will move forward with many pictures of persons with a significantly low amount of hair.

A 'bald' candlestick bar

The reason why there is a trading strategy called Marubozu stems from the type of chart pattern that it relies on. Marubozu pattern relies on a long (but not too long) single candlestick out of a candlestick chart, and yes — this candlestick is bald. How so?

A candlestick chart is a chart that is formed of a series of candlesticks-looking bars. If you want to know how to read a candlestick chart, or you’re still figuring out the many kinds of charts investors and traders use daily, you can find them below:
Stock Chart Basics for Beginners

Let’s look at it in comparison with two of Malaysia’s most known animated characters — Upin and Ipin (this is not a promotion).

So, these two boys are Upin and Ipin. How are they suddenly pulled into our discussion of Marubozu? Here’s how.

As you can see from the image above, the difference between a normal candlestick and a Marubozu (“bald”) candlestick is that a Marubozu candlestick doesn’t have that line you see on a normal candlestick.

That line represents how far the price moved for the day, so in a Marubozu candlestick, you can say that the price movement is very strong. From the example above, we use a green (bullish) candlestick, so what you can say is that the price at the close is higher than its opening price, and the price keeps on rising for the day without going down again at close.

A normal candlestick tells you that the price might have moved higher, but it closed lower than the peak, despite the day still being a bullish day, it’s just not as good as a Marubozu is.

What are annual reports?

Annual reports are a report provided by a company to its shareholders that details out their activities and finances for the financial year. It can also contain other details pertaining to the market, the management, and whatever it is that they feel like putting in there. You can find it online.

In the U.S., however, there is a mandatory filing of the annual report via form 10-K, which has its own structures and formats, and it can appear a bit different from the annual reports booklet you’d find lying around, but the essential structures are the same. Some companies didn’t even bother to craft those fancy booklets and just hand over their 10-K filings to their shareholders.

In this write-up, we will be using the 10-K as our main reference, but you can still apply it to any kind of annual report you find lying around. The core components are still the same. You can use Apple’s 10-K report as a reference, download it here.

Should a Maruobozu Candlestick be fully bald?

A Marubozu candlestick can have a little bit of ‘hair’, but it has to be marginally small that it’s not considered a significant price movement. Let’s take an example.

From the example above, we can see that the open price was $100, and the close price was $200. Meanwhile, the high price for the day was $201, which means that the difference between the highest price for the day and the price when it closed was only $1.

Compared to the whole price movement for the day, which is $100 (open price — close price), $1 is just 1%, which is marginally small. So, you can disregard that tiny bit of hair. Just like bald people, there would be a certain length where you’d consider them bald or not bald.

Marubozu Trading Strategy

Alright, so we have explained what a Marubozu candlestick is. How do you use it for the benefit of your trades?

First, what you need to do is look for it in the wild. A Marubozu must be tall, but not to tall — we will explain later why.

Bullish Marubozu

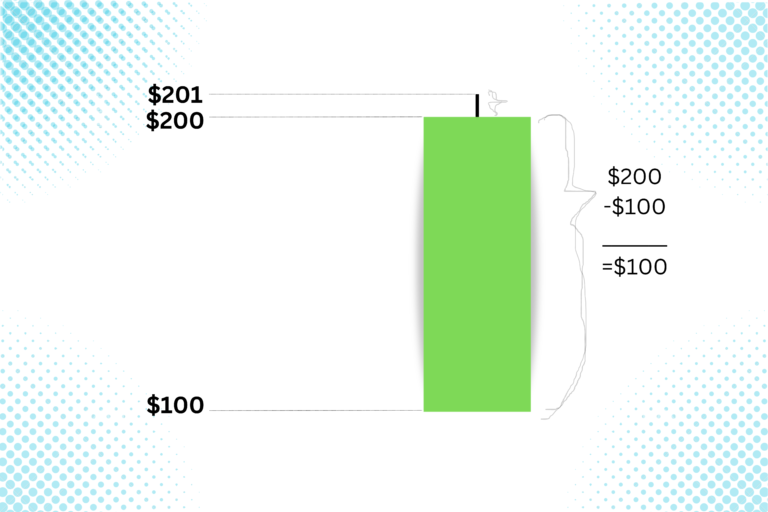
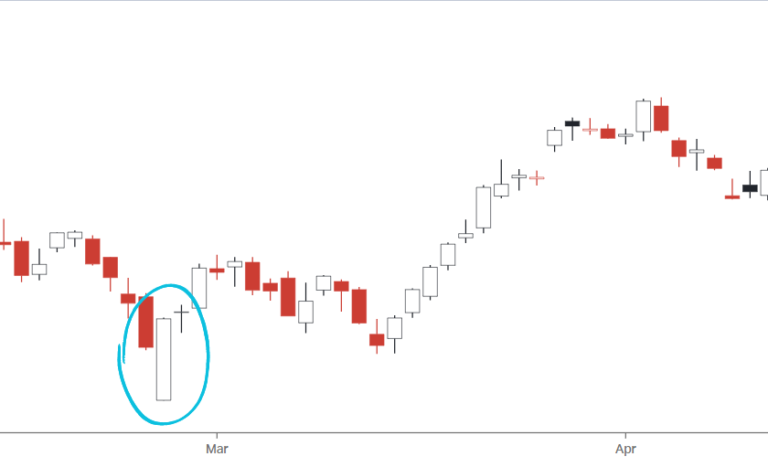
Voila! We caught a bullish Marubozu! This is how it looks like in the wild, but we caught ourselves a tall one — but for the sake of learning, we’ll make do with this one first. A bullish Marubozu refers to a Marubozu candlestick that is moving upwards.

What does it tell you: It tells you that the sentiment in the market is looking good, in which people are buying it at almost every point in time — which causes the price to move upwards continuously, except when it falls a bit from its peak, but it’s too small and negligible. Simply, sentiment is good.

What you should do: There are two ways you can approach this, either by taking a risk or by playing safe. Here’s how it’s going to work:

Risk-taker: A risk-taker will buy the stock on the same day near the market closing time. In the U.S., the market closes at 4 pm. So, what they would do is they’ll see if, within around 30 minutes to 4 pm, it is indeed a Maruzobu candlestick — or did the price drop dramatically? If they can confirm it as a Maruzobu, they’ll buy it. The downside here is that sometimes the sentiment is only good for the day, but it won’t stand well the next day. This is why they’re called risk-takers because Marubozu is usually followed by a bullish trend, but it’s not always confirmed.

Safe players: A safe player would wait until near the market closing time the next day to decide if they’re buying or not. For example, if the bullish Marubozu formed on Monday, a safe player will wait to see how the chart will be at Tuesday 3:30 pm. If the price moves up (it doesn’t have to be a Marubozu, any way up is fine) then they’ll buy it. The downside of using this method is that you’ll have to buy it at a much more expensive price since you’re raking up on two days’ price hikes.

General risk: As with anything in trading, a pattern can be wrong. It may look like it, but if the chart decides it wants to go down, no one is there to say no. This, however, is a risk apparent in every other aspect of investment. If it’s that easy to make money, we won’t be writing this guide.

Bearish Marubozu:

Bearish Marubozu is just like a bullish one — it’s just that it’s going down.

What does it tell you: A bearish Marubozu indicates that the price might go down since the sentiment isn’t looking good, and people are selling at every point.

What to do: It’s either you’re shorting or you’re selling shares that you own. When you’re shorting, much like during a bullish Marubozu, there are two ways that you can approach it, either take the risk or play it safe. What is “shorting”? Find out here:

What is “Short” and “Long” in Trading?

Risk taker: If you’re the kind to take risks, you’ll start short-selling the very same day you see the bearish Marubozu when the market is about to close. The downside of short selling the very same day as the pattern starts to form is you’ll miss the chance to affirm your decision, and there’s a higher chance of you being wrong.

Play safe: If you’re playing safe when you’re short-selling, you’d wait for a day to see if the bearish Marubozu is followed by a downward movement the next day. Once you can see that the price is indeed going down on the second day, you can start short selling near the market closing time. The downside of doing it this way is that you may get a smaller profit from the short sale.

If you’re selling shares that you already own, a safe player would usually sell them the very moment they see that the Marubozu candlestick is forming, while the ones who are taking a risk will see on the second day if the candlestick is showing a consecutive downside.

Why a tall Marubozu isn't favored?

Stop loss. In the Marubozu trading strategy, traders would usually put their stop loss at the lowest part of the Marubozu (for bullish Marubozu) or the highest part of the Marubozu (for bearish Marubozu).

Stop loss is an instruction that you give to your broker (app) to sell your stock automatically once it falls (or rises) to a certain price level so that you don’t suffer that much loss when the price falls and you’re dozing off.

The reason why many put their stop loss at the bottom of the Marubozu is, if they put it somewhere within the price range of the Marubozu, it is a normal thing for the price to move up or down within the Marubozu range before it actually forms a trend (upwards or downwards). So, there’s more likeliness for you to accidentally trigger the stop loss sell as the trend is forming.

Now, imagine you’re rallying on a bullish Marubozu. You would buy it at the end of the day, right? So you’d be buying it at the peak of the Marubozu — the highest price for the day. If the Marubozu is tall, your stop loss will be deep!

Imagine if you bought Stock A (normal Marubozu) and Stock B (tall Marubozu) at $100. The stop loss level for Stock A is at $50, while the stop loss for Stock B is at $20. If both stop losses are triggered, you’re looking at only a $50 loss in Stock A but for Stock B it’s an $80 loss!

How do you know if a Marubozu Candlestick is Too Tall or Too Short?

A Marubuzo is considered too long when the open price is more than 10% away from its close price. It’s considered too short when the open and close prices are just 1% apart.

For example, the price of Stock ABC opened at $100 and closed at $112. That’s a 12% increase — so, it’s too long.

Now before we part

  • Marubozu pattern is a good indicator of strong market sentiment.
  • It’s reflected by a candlestick that doesn’t have a significant ‘tail’ length to it.
  • You can reaffirm your guess by looking at the price movement on the second day.
  • Only sell when it reaches the stop loss point or your target point for profit.
  • This is only a pattern that suggests how the trend might be, but it’s not a guaranteed result.
  • Avoid trading when the candlesticks are either too long or too short.

Do keep an eye out for our posts by subscribing to our channel and social media.

None of the material above or on our website is to be construed as a solicitation, recommendation or offer to buy or sell any security, financial product or instrument. Investors should carefully consider if the security and/or product is suitable for them in view of their entire investment portfolio. All investing involves risks, including the possible loss of money invested, and past performance does not guarantee future performance.

Written By

Become a AXEHEDGE investor today.