AXEHEDGE

Stock Chart Trading: Hanging Man

How can a single candlestick tell you what’s hangin’?

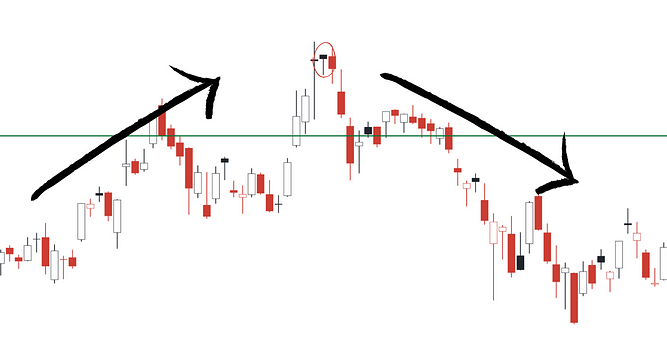
The Hanging Man pattern is a red flag to many traders. It refers to a candlestick chart pattern that typically indicates a potential reversal of an uptrend, which essentially means that the bull rally might be coming to an end. It forms when a small-bodied candlestick with a long lower shadow (wick) appears after a sustained uptrend, resembling a hanging man with outstretched arms.

So, whenever you see a hanging man during an uptrend, you might want to be careful with the positions that you still have, or it could also signal an opportunity for you to start short-selling.

Characteristics of The Hanging Man

 
Just like the hammer pattern, it consists of a small-bodied candlestick with little or no upper tail, and a long lower tail that is at least twice the length of the body.

It almost looks like Thor’s hammer. Heck, you can even say that the hammer pattern and the hanging man pattern are two sides of the same coin.

However, unlike the hammer, the hanging man appears after a prolonged uptrend, suggesting a potential trend reversal. (The hammer would usually appear after a downtrend).


What does the hanging man tell you?

First, it appears during an uptrend. So, we know that prior to the appearance of the hanging man, the market sentiment was bullish, and people are buying more than they are selling, so the price keeps on rising.

However, as the hanging man appears, the long lower shadow indicates that prices have dropped significantly during the trading session but managed to rebound, leaving the body near the top of the trading range. What happened in that period is that the sentiment of the market may be facing some changes, where people start to sell more and more, forcing the price down drastically, despite the buying sentiment forcing it back upwards.

Now, what it tells us is that someone is knocking at the door, and it might be the bears.

How to trade?

There are generally two ways that you can approach the hanging man, in a riskier way or a more risk-averse way.


Risky:


You can wait until the very next day’s near-to-close price to see if the day actually ends in red. If the day ends in red, then you can say that the bear is confirmed, and you can start selling your positions around an hour before the market closes.

Why this is risky because you are holding your position to see if the trend actually forms or not. If the bearish trend is found to be true, the moment that you want to sell is already the moment when the price has fallen. So, you’re taking a risk by waiting to see if the price falls in the hope that maybe the signal is false, and the price continues to rise.

If you’re short-selling, you can enter your short-sell immediately below the hanging man candlestick and you can consider putting your stop loss on the upper part of the hanging man.


Risk-Averse:


If you hold a position in the asset, you can sell it immediately. If the trend turns out to be a false alarm, at least you have made as little as you can from your transaction. However, you’ll have to consider your profit and loss from the trade, whether it’s worth it or not.

If you’re short-selling, you can enter your short-sell a day after, that is if you see that the day is ending in red — confirmation that perhaps a bear market is approaching.

You might also want to set a tighter stop-loss level to minimize potential losses if the trade goes against you and set a conservative profit target, such as a smaller profit target or a partial profit-taking approach, to lock in gains and protect your capital.

Take-Profit: Set a conservative profit target, such as a smaller profit target or a partial profit-taking approach, to lock in gains and protect your capital.

Bottom line

  • The hanging man pattern would usually indicate that the market will reverse from bullish to bearish.
  • The Thor-hammer-shaped candlestick must form at the top of an uptrend.
  • There can be instances that it might not work, and prices just continue rising.
  • Stick with your plan, more money is lost from following your emotions. If you lose today, so what? Make more tomorrow.
  • From our personal perspectives, the likeliness of a hanging man actually triggering a bear is relatively lower compared to many other patterns.

Do keep an eye out for our posts by subscribing to our channel and social media.

None of the material above or on our website is to be construed as a solicitation, recommendation or offer to buy or sell any security, financial product or instrument. Investors should carefully consider if the security and/or product is suitable for them in view of their entire investment portfolio. All investing involves risks, including the possible loss of money invested, and past performance does not guarantee future performance.

Written By

Become a AXEHEDGE investor today.