An engulfing candlestick pattern can be either bullish or bearish, depending on the direction of the price movement. A bullish engulfing candlestick pattern occurs when a small red (bearish) candle is followed by a large green (bullish) candle that completely engulfs the small red candle.
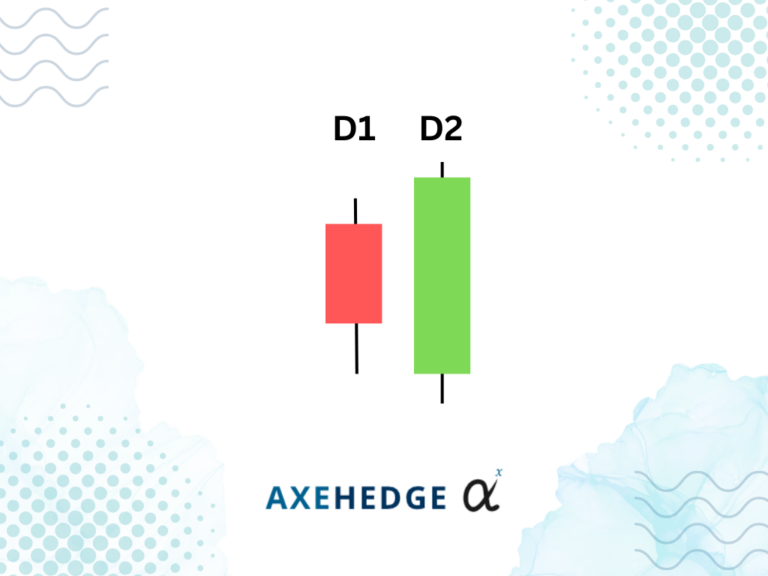
The pattern will often occur within two consecutive periods (usually days) in the market. To make identifying easier, we’ll first name the small one as D1 (referring to day 1’s candle) and D2 (referring to day 2’s candle).
Here’s how you can identify a bullish engulfing candlestick:
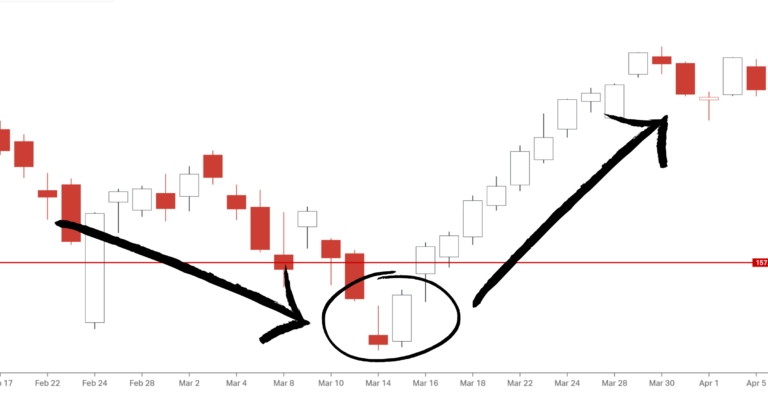
- The market is in a downtrend.
- D1 opens lower than the day before and somewhat ends up even lower (red candle).
- D2 opens at the same point, or lower than D1’s closing price, but ends up closing higher than D1’s price.
- So, it appears that there’s this one small red candle at the bottom of the trend followed by a huge green candle.
- Do note, that slight variation in price, for example, if D2 opens higher than D1, but the margin is too small — then it’s fine.
Quick question,
Does the D2 candle have to engulf only the body of the D1, or does it have to engulf everything including the tails? The safe answer to it is that it actually depends on your personal experience, depending on the type of stocks or the market you’re trading in.
The less safe answer is that there are two schools of thoughts when deciding if it’s considered an engulfing candlestick or not, one says that D2 needs to engulf every single bit of the D1, while another is of the opinion that as long as the body of the D1 is engulfed by D2 that’s fine.