AXEHEDGE

Stock Chart Trading: The Spinning Top

Spin Your Way to Success: Decoding the Spinning Top Candlestick Pattern

In our previous article, we explained to you about the Marubozu Chart and how a single candlestick in a candlestick chart can tell you so much about how the market is doing — the emotions, the prospect, and what can you do with your money as it forms.

Now, if you have absolutely no idea about the different charts available when trading, and what each of them indicates, this article will clear things out:

Stock Chart Basics for Beginners

Characteristics of a Spinning Top candlestick

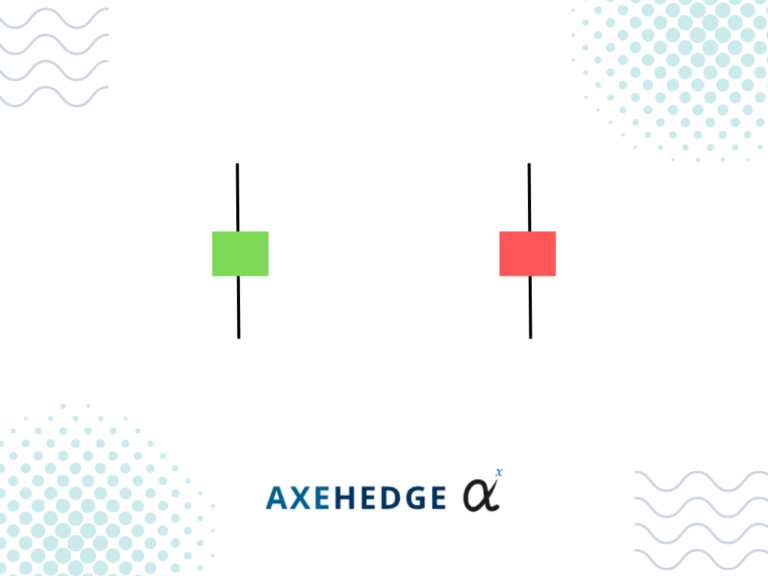
The picture above shows what a spinning top candlestick looks like. What are the most notable features of the two charts above?


Short Body in the middle


If you look at a spinning top chart, one thing that you’ll most likely note is that the body of it is short and stout relative to its tail. What does this mean?

We’ll look at it from two perspectives — if the chart is green or when it’s red. If it’s green, it means that the price closes higher than it opens, and if it’s red, it closes lower. The notable part about this is not if it closes lower or higher, but the fact that the distance between the two prices is very near to each other.

What this means is that the price moves very little for the day. By now you would’ve sighed “thank you, captain obvious”, but wait until we get to the tails and then we’ll get the full picture of what’s going on.

Before we get there, we would also like to point out how this stout body is in the middle between the tails (in real life, it doesn’t have to be exactly in the middle. A little disproportion is acceptable.

Long tails on both ends


This is where a spinning top chart tells you what you need to know. If you look at the chart, you can see that both it tails at the top and at the bottom are long. The tail at the top tells you that the price has moved up to that point for the day, and the one at the bottom tells you that it fell by that much for the day — all of these movements happen until the price goes to its closing price.

Okay, what does it mean? We will look at it in a green–red chart situation.

If it’s green: what it means is that the price moved up so high for the day, which means that people tried to push the price way higher, but it wasn’t successful, and the price only closed a bit higher than when it opened. The price also fell way lower, which means that the bearish market sentiment also tried to take over the chart, but they too failed as the price closed a bit higher than when it opened.

If it’s red: the price moved up high, which shows that bullish market sentiment tried to take the price higher, but failed as the price closed a bit lower than when it opened. The bearish sentiment has also tried to drag the price way lower, but they too, failed as the price closed only a bit lower than when it opened.

So, what does it all eventually mean? It means that the market is indecisive. Both bull and bear were playing tug-of-war and ended at an impasse — the middle ground.

How do I use Spinning Top Chart for my trades?

Alone, a spinning top chart can only tell you that the market is indecisive, but if you see it forming during a certain market trend, then it can tell you how you should position yourself. Let’s take a look at how you should react when it happens during an uptrend and downtrend.

Uptrend

So, here’s the information that you have from the chart:

  • The sentiment was bullish, and now it’s uncertain.
  • Bearish sentiments have entered the picture, and people are now uncertain.
  • The trend can either continue going up, or it can reverse to a downtrend.

From the information above, what you can say is now people are at a junction where they can choose whether the trend is going to continue or if it’s going to go in the opposite direction.

Here’s what you might want to do:

  • Minimize your position size in the market.
  • If you want to hold, you can hold half the amount you already have, and sell the other half while you’re still making a profit. If the trend continues, you’ll still have a stake in there, but if it reversed into a downtrend, at least you’ve made a profit from the other half you sold.
  • If you want to short the stock, allocate half the actual amount of money you want to short with. If you have $1,000, perhaps you can use just $500 for the shorting.
  • Some traders choose to just stay away from an uncertain sentiment like this.

Downtrend

So, here’s the information that you have from the chart:

  • The sentiment was bearish, and now it’s uncertain.
  • Bullish sentiments have entered the picture, and people are now uncertain.
  • The trend can either continue going down, or it can reverse to a downtrend.

From the information above, what you can say is now people are at a junction where they can choose whether the trend is going to continue or if it’s going to go in the opposite direction.

Here’s what you might want to do:

  • Minimize your position size in the market.
  • If you want to buy, you can buy half of the amount you’re expecting to spend. For example, if you have $1,000 to spend, you might want to just spend $500 on it — if you win, a win is a win, but if you lose, at least it’s only 50% of the money you have.
  • If you want to sell the position you’re currently holding to cut down on the losses, you can sell half of it first, just in case the trend takes a turn for the better, at least the other half of your holdings can try to offset your loss as much as it can.
  • Some traders choose to just stay away from an uncertain sentiment like this.

Bottom line

  • A spinning top indicates confusion and indecision in market sentiment.
  • If it appears during a trend, it means that the opposite sentiment has entered the picture, but whether they will succeed or not in turning the trend another way is hanging in the balance.
  • The trend can either continue or it can reverse.
  • Minimizing your position is not a bad idea when this happens.

Do keep an eye out for our posts by subscribing to our channel and social media.

None of the material above or on our website is to be construed as a solicitation, recommendation or offer to buy or sell any security, financial product or instrument. Investors should carefully consider if the security and/or product is suitable for them in view of their entire investment portfolio. All investing involves risks, including the possible loss of money invested, and past performance does not guarantee future performance.

Written By

Become a AXEHEDGE investor today.