AXEHEDGE

Financial Ratio: Valuation Ratio (Part 3)

How to Calculate Price to Earnings Ratio?

Just to get us up to speed, when considering investments or trades, there are generally two approaches used by people to analyze their prospects. These approaches are known as technical analysis and fundamental analysis.


Each approach utilizes different methods to evaluate the worthiness of companies. In this case, we will focus on the fundamental investors, also known as value investors, and their way of evaluating investments.


Simply, fundamental investors seek to identify the intrinsic value of a company. They do this by examining the financial statements of the company, including the Profit & Loss StatementBalance Sheet, and Cash Flow Statement. You can click on the hyperlinks provided for a simple guide on how to read these statements.


How do they examine all the financial statements above? By using financial ratios! If you want a general overview of how financial ratios work, check out this article — Fundamental: Introduction to Financial Ratios.


Before this, we discussed three out of the four branches of financial ratios: There are four branches of financial ratios available: ProfitabilityOperatingLeverage, and Valuation — we are currently looking at a branch under valuation ratio.


Here’s a chart of (almost) everything under the financial ratio:

Price to Earnings Ratio (P/E)

The Price-to-Earnings (P/E) ratio is a financial ratio that compares a company’s stock price to its earnings per share (EPS). It provides insights into how much investors are willing to pay for each dollar of a company’s earnings. It is used to assess the valuation of a company’s stock. It helps investors evaluate whether a stock is overpriced or underpriced based on its earnings performance.


However, A high P/E ratio does not necessarily mean that a stock is overvalued, as it could also reflect high growth expectations. Similarly, a low P/E ratio does not automatically mean that a stock is undervalued, as it could indicate low growth expectations or other factors impacting investor sentiment.


When using the P/E ratio for comparison, it is essential to consider industry norms, company-specific factors, and compare the ratio with peers before making investment decisions. The P/E ratio is just one factor to consider in a comprehensive analysis of a company’s financial health and valuation.

How to calculate the Price-to-Earnings (P/E) ratio?

Before we start, for the examples below, we will use Apple’s annual report (FY2022) which you can download here. There’s no particular reason why, it’s just that Apple’s report is relatively structured and easy to use.


Also, in the real-life application, it’s advisable for you to use the latest available data, based on their latest report (usually), but since ours is just to tell you the methods of calculating it, we don’t mind using the a-bit-outdated report. When you’re doing it in real life, it concerns your money, try to get the latest data possible.


The formula for the P/E ratio is as follows:

Price to Earning Ratio = Current Market Price / Earnings Per Share

Where,

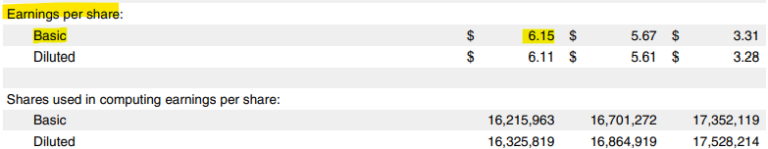
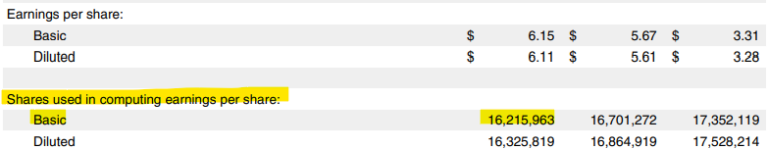
Earnings Per Share = Earnings / Weighted Average Number of Shares Outstanding


First, we’ll look into Apple’s current market price, but since the report is published in late September 2022, we’ll pretend that the current price is the price at that point of time which is $142.48 (as of September 29th, 2022).


Now, to look for EPS we will need its earnings and weighted average number of shares outstanding.


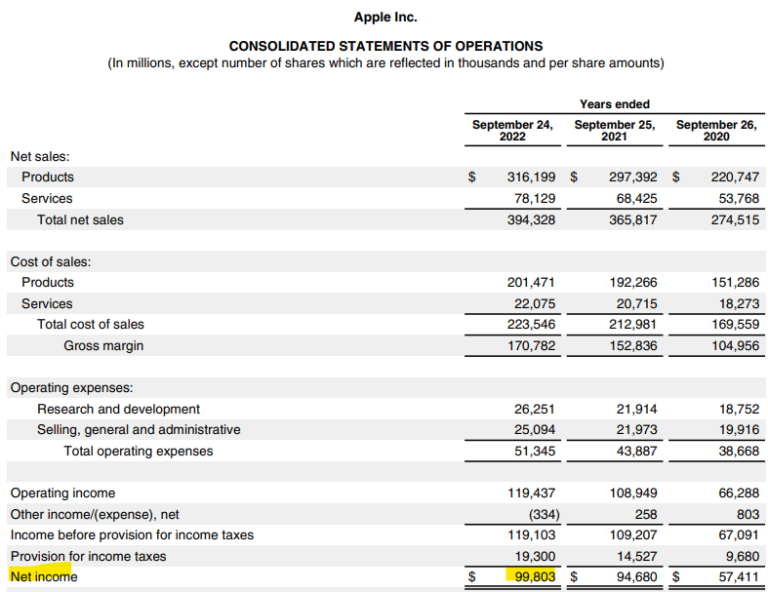
Here is Apple’s earnings which is $99,803 million. Do note that when we say earnings, we refer to the net income, and when say revenue, we refer to the net sales (a bit on the top in the table below).

In many cases, a company’s annual report will already provide you with the EPS value, but for learning’s sake, we’ll dive into it anyway. See below how Apple has already provided you with the EPS.

As for its weighted average number of shares outstanding, you can find it in the same place, whereby Apple cut the crab (my editor doesn’t allow harsh words) and just give it straight away. Now, see how there are two types: Basic and Diluted.

Which one should you choose? The answer is, people would most likely look into the basic one, but in some cases, diluted EPS may be more appropriate to use if the company has a significant number of potential dilutive securities that are likely to be converted or exercised. For this, we’ll just have the basic, which is 16,215,963,000 units.


Now, take all of those numbers and chuck it into the formula again.

Price to Earnings Ratio = Current Market Price / Earnings Per Share

Price to Earnings Ratio = [ Current Market Price / (Earnings / Weighted Average Number of Shares Outstanding)]

Price to Earnings Ratio = [ 142.48 / (99,803,000,000 / 16,215,963,000)]

Price to Earnings Ratio = 23.17


So, what you can say is, as of September 29th, 2022, people are willing to pay 23.17 times Apple’s earnings for each share of stock. Easy, isn’t it?

Bottom line

  • The P/E ratio is used to assess the valuation of a company’s stock.
  • It provides insights into how much investors are willing to pay for each dollar of a company’s earnings.
  • Price to Earnings Ratio = [ Current Market Price / (Earnings / Weighted Average Number of Shares Outstanding)]
  • The P/E ratio is just one tool that investors can use to evaluate a stock.
  • It is important to consider other factors, such as the industry norms, company-specific factors, and compare the ratio with peers before making investment decisions.

Do keep an eye out for our posts by subscribing to our channel and social media.

None of the material above or on our website is to be construed as a solicitation, recommendation or offer to buy or sell any security, financial product or instrument. Investors should carefully consider if the security and/or product is suitable for them in view of their entire investment portfolio. All investing involves risks, including the possible loss of money invested, and past performance does not guarantee future performance.

Written By

Become a AXEHEDGE investor today.