How to calculate Price-To-Sale ratio, a step-by-step guide.
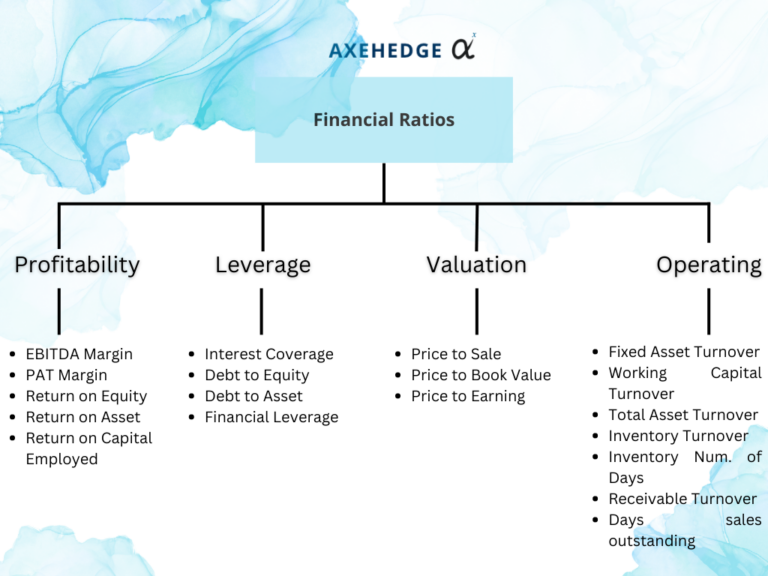
Welcome back to another part of our financial ratio series. Before this, we discussed three out of the four branches of financial ratios: There are four branches of financial ratios available: Profitability, Operating, Leverage, and Valuation.
Please also look at the chart below to get a full picture of where we are.
If you want to zoom out a little bit more, here’s where this topic falls under:
When considering investments or trades, there are generally two approaches used by people to analyze their prospects. These approaches are known as technical analysis and fundamental analysis.
Each approach utilizes different methods to evaluate the worthiness of companies. In this case, we will focus on the fundamental investors, also known as value investors, and their way of evaluating investments.
Simply, fundamental investors seek to identify the intrinsic value of a company. They do this by examining the financial statements of the company, including the Profit & Loss Statement, Balance Sheet, and Cash Flow Statement. You can click on the hyperlinks provided for a comprehensive guide on how to read these statements.
How do they examine all the financial statements above? By using financial ratios! If you want a general overview of how financial ratios work, check out this article — Fundamental: Introduction to Financial Ratios.
Price-To-Sale (P/S)
The Price-to-Sales (P/S) ratio is a financial ratio that compares a company’s market capitalization (or its stock price) to its total sales revenue. It provides insights into how much investors are willing to pay for each dollar of sales the company makes.
A lower Price-to-Sales ratio generally indicates that a company’s stock is considered relatively undervalued compared to its sales revenue — simply, it’s a cheap buy for such a profitable company.
How to calculate Price-To-Sale (P/S) ratio?
Before we start, for the examples below, we will use Apple’s annual report (FY2022) which you can download here. There’s no particular reason why, it’s just that Apple’s report is relatively structured and easy to use.
The formula for the P/S ratio is as follows:
Price-to-sale = Current Share Price / Sales Value per Share
Where,
Sales Value per Share = Total revenue / Total number of shares
Note: There are a few other formulas out there, and each will result slightly differently, make sure to use the same formula if you’re comparing the same ratio of two companies.
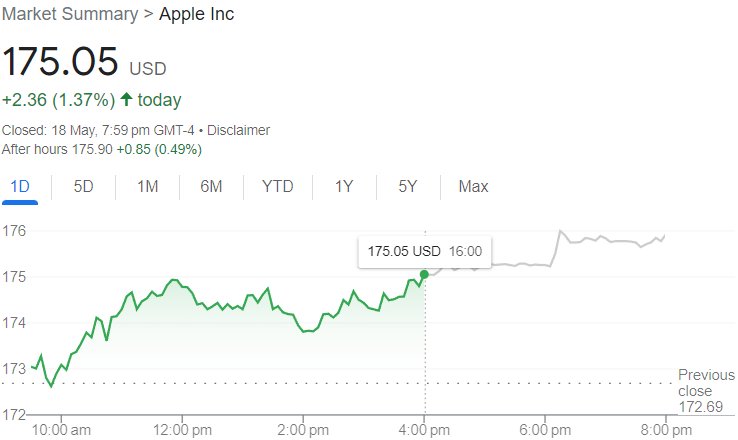
So, for the current share price of the company, you can find it just by Googling it. In our example, we use Apple, so the price as of May 18th, 2023, is $175.05.
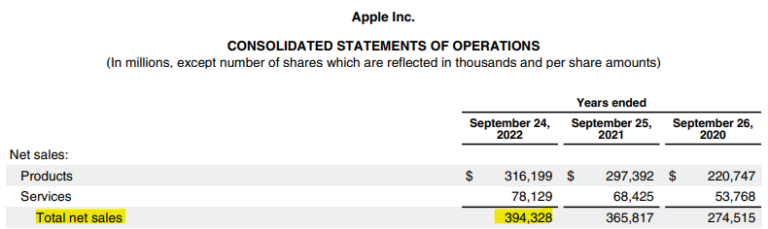
As for the Sales value per share, we need to find the value of its Revenue and its Number of Shares. If we refer to the 2022 Annual Report (As of September 2022), we can see that the Revenue is at $394,328 million. But it says “sales” not “revenue”? Yes, but they both refer to the same thing — where does Apple get its revenue from? Yep, their sales.
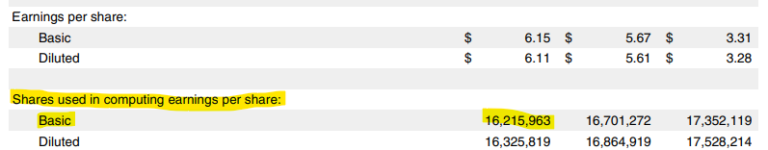
As for the number of shares, you can find it also in their Statement of Operations, i.e., at 16,215,963,000 (the multiplier is ‘000), where we use their Basic share numbers (not diluted). Why? Because the “Basic” value is… well, untainted? Is that the word? It gives you a more accurate insight.
So, let’s do our calculation from the values we got:
Price-to-sale = Current Share Price / [Total revenue / Total number of shares]
This means that people are paying 7.2 times for every dollar of sale Apple is making. Isn’t that kind of high? Maybe, but you won’t get the real picture unless you look at other indicators, as well as compare Apple’s indicators with its competitors’ indicators such as comparing Apple’s P/S ratio to Microsoft’s P/S ratio, etc.
Bottom line
The price-to-sale ratio is a valuation metric that compares a company’s stock price to its revenue.
It is calculated by dividing the current share price by the total revenue for the past 12 months.
A higher price-to-sale ratio indicates that investors are paying more for each dollar of revenue.
A lower price-to-sale ratio indicates that investors are paying less for each dollar of revenue.
The price-to-sale ratio is just one tool that investors can use to evaluate a stock.
It is important to consider other factors, such as the company’s earnings, growth prospects, and risk profile, before making an investment decision.
Do keep an eye out for our posts by subscribing to our channel and social media.
None of the material above or on our website is to be construed as a solicitation, recommendation or offer to buy or sell any security, financial product or instrument. Investors should carefully consider if the security and/or product is suitable for them in view of their entire investment portfolio. All investing involves risks, including the possible loss of money invested, and past performance does not guarantee future performance.