AXEHEDGE

Financial Statement: How to read a Profit & Loss Statement

Understand the basics of Profit & Loss Statement.

In one of our articles, we wrote about how one can look into the annual report (or quarterly report) to pry into the financial well-being of a company. If you haven’t yet read our piece, you can find it here:

Fundamental Analysis: Invest Based on Annual Reports

Now, what you will learn from this article is on what are the information provided in a Profit & Loss statement. We will not yet delve into the methods that are used in churning all this information into a fundamental evaluation as that will require a much lengthier explanation and another article in itself.

Overview

Before we proceed any further, we would like to give you a general overview of where we are.

In deciding which asset to buy, investors/traders often result to two main methods — fundamental analysis and technical analysis. Fundamental Analysis seeks to look for the actual value of a particular asset, not just look at the price that it’s listed at. Technical Analysis is more concerned with the market sentiment surrounding the asset rather than the asset itself.

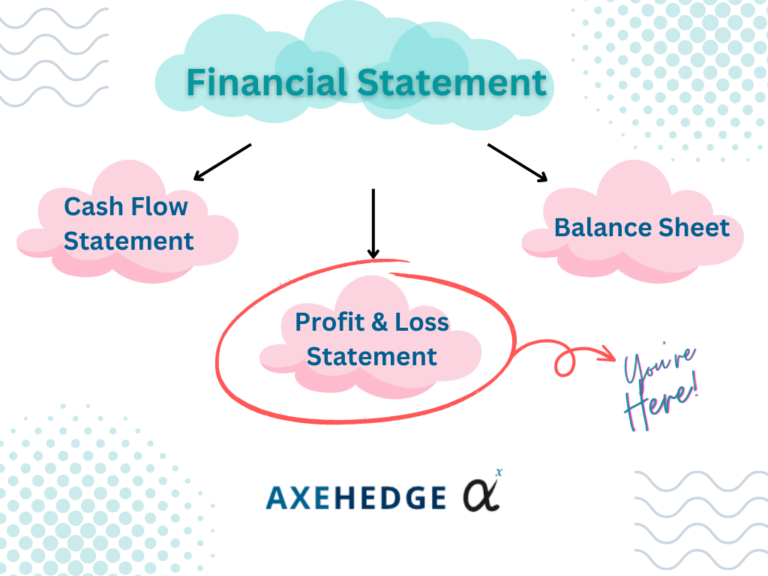
One of the many things that a fundamental analyst would look into to understand the value of a company is the financial statements of a company. Under this financial statement label, there are generally three main documents that the analyst would look at: Profit & Loss Statement (P/L), Balance Sheet, and Cash Flow Statement.

What to look for in a Profit & Loss Statement?

There are generally four main conclusions that you’ll need to get from reading a P/L statement:

  • How is the revenue?
  • Are the expenses incurred to generate the revenue good/reasonable/bad?
  • How much additional losses did they incur from taxes & depreciation?
  • How are the earnings per share (EPS) looking?

Let's move into the details…

Basic knowledge:

Now, before we dwell any further, it is important for you to be aware of two things:

See the time of the publication: First, know when the report was published, and you’ll also have to know if it’s a quarterly report or an annual report. The way to do it is simply by looking at the title of the report, or the preamble. Knowing this is important because each timeframe will have its own gravity in the evaluation of a company.

Say, you want to invest in Company A for the span of just a year. In this case, it’s better if you look at its quarterly performance. It’s better if you can look at both, but your decision will rely heavily on either one of the two.

See the currency denomination: When the company presents its financial data, be sure to look at the currency denomination. We’ll explain it through the example below.

The currency denomination here is when it states “(dollars in millions)” which means that a single digit represented in the table equals a million, e.g., $1 = $1,000,000.

Yes, the things we mentioned above are perhaps really basics to many, but many of those who are just new to finance might not be aware of this.

The cores of a Financial Report:

Before we start, do know that sometimes the terms used are different from one company to another, but if you look at the data they present, you’ll know they are referring to the same thing.


1. Things concerning profits and revenues.

Net sales (or net revenue):

This refers to the amount of sales made by a company. From the example above (it’s Apple’s 2021 Report), we can see that the sales are divided into products and services. Usually, companies would lay down their business activities here.

Apple (from above) made it clear that their two core businesses are in products and services (they did detail out what are the products and businesses in another part of the report). From this, you can generally see three things:

  • Which part of their business makes the most money.
  • How much are they making for the year.
  • Is the amount of money they’re making this year better than the years before?

Operating income:

Operating income is simply how much they are making when they actually take into account the cost of producing their products/services and the cost of operating their business.

The formula of operating income is –

Operating income = Total revenue — Cost of goods sold — Operating expenses

From this, you’ll see the actual money that the company is making for the year, and you can compare it to the amounts from the years before.

Another thing that you get from the table above is “Income before the provision of Income tax”, or what is also known as Profit Before Tax (PBT).

PBT is calculated by the following formula:

PBT = Total revenue — operating expenses

PBT is important because it is the basis to calculate Profit After Tax (PAT) which gives you a glimpse into how much you will have to operate in the next term. PAT’s formula is as follows:

PAT = PBT — All taxes

Let’s shake off all these fancy terms to make it more understandable. It’s pretty straightforward and logical. If a company makes money in a year, what will it use the money for (after paying for expenses, taxes, etc.)?

No, not charity, of course! They’ll use it to run their business the very next year. So, with how much they make that year, you can roughly tell how much they will have to spend the next year (without taking into account next year’s income).

Anyway, some reports may include a slot for an “exceptional item” or whatever the company decides to label it as — it stands for expenses that are accrued for the year, but it will most likely not happen again the next year.

Let’s take an example, Company ABC operates a few of its factories in Country XYZ. In the year 2020, Country XYZ was hit by an earthquake that damaged Company ABC’s factories and equipment. So, these expenses are considered special expenses that may not be incurred again in the near future.


2. Things concerning expenses.

Expenses:

Here, you can find a few things:

  • How much Apple incurred to produce its products?
  • How much Apple incurred to provide its services?
  • How much Apple incurred in its operating activity?
  • Research and development (R&D) spendings are one of the most looked-at expenses — it tells you how serious the company is in improving its products/services.
  • Fun fact — you can also get a general guess on how well a company pays its employees by comparing the margin of its income with its operating expenses.

Finance Cost/Debt/Interest:


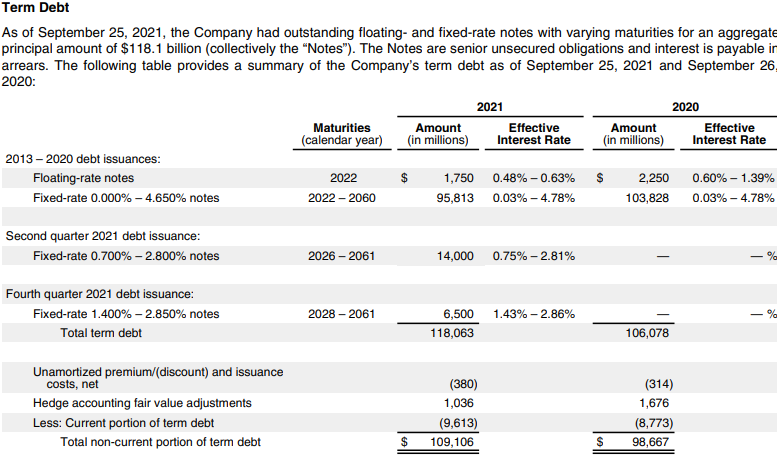
There are actually many other ways in which debt is labeled — given how many instruments there are to borrow money. For Apple here, we can see that apart from the usual way of borrowing, they use Commercial Paper as their instrument of borrowing money. From the above, we can learn a few things:

  • How much does Apple get from issuing commercial paper.
  • How much Apple spends to repay the commercial papers.
  • How much interest are they paying for the debt (from above, it mentions that the rate was at 0.06%).
  • How much Apple accrued in interests and penalties
  • How much Apple spends on paying interest and penalties.

Depreciation & Amortization:


Depreciation is usually used for tangible assets while amortization is for intangible assets. What do they mean? They are an accounting method that is used to spread the cost of buying/acquiring assets through their useful life period.

For example, in 2022, Apple bought a machinery that can help in the production of iPhones. The machine cost $1,000,000. The machine can function for approximately 10 years.

So, instead of putting in its P/L statement an eye-watering (-$1,000,000) for one machine, what Apple can do is it will distribute the cost of the machine throughout the machine’s useful life — i.e., by spreading $1,000,000 for 10 years. So, Apple’s P/L statement will reflect a -$100,000 for 10 years upon the purchase of the said machine. From this, you can see:

  • How much Apple is still paying in acquiring its assets.
  • One of the reasons people look at cash flow statements rather than P/L statements is because of this — they want to know how much the company actually spent for the year.

Other expenses:


This is where companies put other expenses they want to put. As for Apple, we can see from the example above that it chose to put its other income or expenses together with its interest and dividends-related transactions. From the above you can see:

  • The total of Apple’s other income as opposed to its other expenses is positive, which means that it made more from other sources than it spent on other sources.


Tax:


From above, there isn’t much to explain, apart from the difference between deferred and current tax. A current tax refers to the amount of tax that they will have to pay within the financial period, meanwhile, deferred tax is when the tax is supposed to be paid, but at a later date than the financial period.

So, from Apple’s P/L statement above, you can see that Apple paid $9,424,000,000 in Foreign Income Tax, meanwhile, they will pay $2,740.000,000 at a later date.

From this, you learned on:

  • The difference between current and deferred tax.


3. Earnings Per Share


Earnings per share (EPS) is one of the most valuable insights that one can get from going through a P/L statement. 

It literally tells you how much a single share of the company’s stock is worth It tells you how much a share of the company makes in revenue. EPS is calculated using the formula below:

EPS = Profit After Tax Outstanding Shares

Bottom line

So here are the things that you’ll need to look at first when you read a P/L statement:

  • Sales/Revenue
  • Profit before tax
  • Profit after tax
  • Total operating revenue
  • Expenses
  • Financial-related costs (interest, borrowing cost, etc.).
  • Depreciation & Amortization
  • Earnings per share

Do keep an eye out for our posts by subscribing to our channel and social media.

None of the material above or on our website is to be construed as a solicitation, recommendation or offer to buy or sell any security, financial product or instrument. Investors should carefully consider if the security and/or product is suitable for them in view of their entire investment portfolio. All investing involves risks, including the possible loss of money invested, and past performance does not guarantee future performance.

Written By

Become a AXEHEDGE investor today.