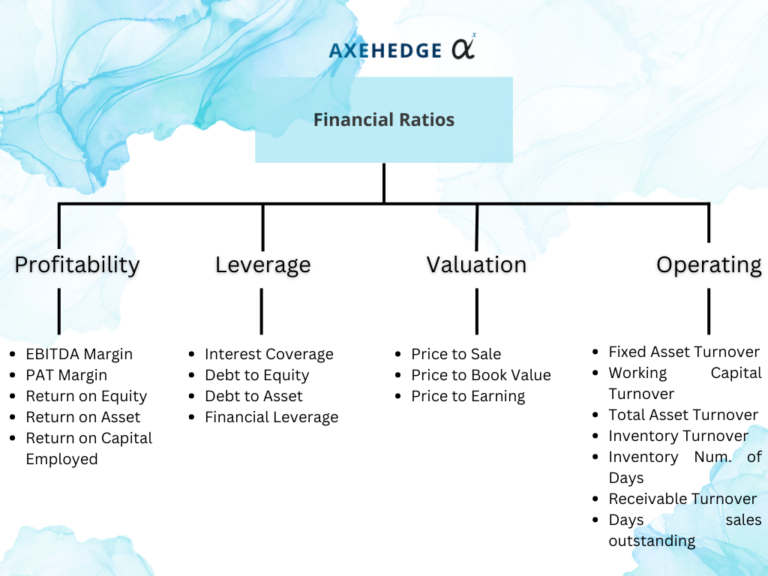
As you can see above, under each category there are many individual ratios available. We will try to explain it in general. However, the details of each ratio such as how to calculate them etc., will have to be explained in another write-up.
1. Profitability Ratios
The profitability ratio tells you how well a company can generate profit. This is vital in deciding on the prospect of growth and expansion for the company. There are many ratios under this category.
EBITDA Margin: This ratio essentially tells you how much a company makes, having taken into account its operational expenditures (without taking other expenses into account), so you can know how profitable a company is compared to its peers when the concern is on how efficient are its operations.
PAT Margin: Profit After Tax (PAT) Margin tells you how profitable a company is after all the expenses have been considered. This is useful for you to get a sense of the overall profitability of a company.
Return on Equity (ROE): Return on equity is used by investors to see if it is worth it to pay that much to acquire shares in a company. It essentially tells you how much the company is making through every unit of shares it issues. A higher RoE would generally mean that the share is more worth it, and that the management team of the company knows of better ways to utilize the money you gave them compared to other companies.
Return on Asset (ROA): Return on assets tells you how well a company utilizes its assets. A good company would invest in assets that can increase its productivity.
Return on Capital Employed (ROCE): It tells you about the profitability of the company in relation to the capital invested in the business. This will take into account the company’s debt, equity, assets, and liabilities.
2. Leverage Ratios
Leverage ratio (also known as Solvency/Gearing Ratio) refers to the ratios that measure how sustainable is a company in terms of its ability to meet its obligations (while also trying to make a profit). These ratios will mostly focus on how well a company uses debt to finance its growth.
Interest Coverage: This is also known as debt service ratio. It tells you how well a company can pay its interest. A high interest coverage ratio would mean that the company is more able to pay its interest, and a low interest coverage ratio would mean that there is a likeliness that the company may not be able to pay its interest — i.e., it can go for default or bankruptcy. Imagine if you make $100 to pay $10 every month, compared to when you make $20 to pay $10 every month, which one is riskier? The latter, right? That is essentially what the interest coverage ratio wants to look at.
Debt to Equity: The debt to equity ratio tells you how much debt a company has compared to the total equity. It has a middle-point of 1, where the bigger the debt to equity ratio, the riskier a company is since it has a higher leverage, meanwhile a debt to equity ratio that is less than one shows that a company has more equities than debt.
Debt to Asset: Debt to asset ratio tells you how much of the company’s assets are being funded by debts. The higher the percentage of a debt to asset ratio, the riskier a company is, since it tells you that most of the company’s assets are funded through debts.
Financial Leverage: This is actually very similar to the debt to equity ratio. It tries to look into how much of the assets are supported by equities.
3. Valuation Ratios
Valuation ratio will tell you if the stock is worth the money you pay for it. The usual angle from which investors look would be how expensive is the stock price in relation to its profitability.
Price to Sales (P/S): Sales are not the same as revenue, whereby revenue value may be affected by accounting matters which may not give investors an accurate representation of how much the company is making for that period. Essentially, it tells you how much a share in the company is worth by looking at the sales value.
Price to Book (P/B): Book value here refers to the face value of the company. Just imagine if the company is being liquidated, it will use all its assets to pay all of its liabilities. The remaining money/asset left after that is its book value. So, if you buy a company with a P/B ratio of $20, it means that one share equals $20 in the company’s book value. So, you might want to look for shares with a low price but a high P/B ratio.
Price to Earning (P/E): It tries to measure the price of a share in a particular company in relation to the company’s earnings. What you can get from this is how much profit is generated when a company issues one share. The more profit generated means that the company is able to use the money they get from the issuance of shares more efficiently.
4. Operating Ratios
Operating ratio (also known as activity ratio) tells you how well a company conducts its operation, whereas, in simpler terms, you can say that it measures how efficient a company is in its day-to-day operations. Does a company spend more to generate the same amount of revenue as its competitors? This is the kind of question that these ratios seek to answer.
Fixed Assets Turnover Ratio: It tells you how much a company makes in relation to its investments in fixed assets. If the company invests more but is making less, then you know it isn’t the best company for you to invest in.
Working Capital Turnover Ratio: It measures a company’s ability to efficiently use its working capital to generate revenue. The higher the ratio is, the more promising a company is.
Total Assets Turnover Ratio: This ratio tells you how much revenue a company can generate from the number of assets that it has. The bigger the ratio is, the better the company is, since they are able to make more money using fewer assets.
Inventory Turnover Ratio: The inventory turnover ratio simply tells you how popular the products/services are by looking at how fast the inventory of a company is moving. If the product is popular, the inventory will move very quickly. If the ratio is low, it means that the company either tends to overstock or that they are having a hard time selling its products. Do note that different types of companies may have different inventory turnover ratios, a company that sells food may restock its inventories more rapidly than a company that provides consultation.
Inventory Number of Days: The Inventory Number of Days is a financial ratio that measures the average number of days it takes a company to sell its entire inventory. It is also known as Days’ Inventory on Hand or Inventory Days. The higher the number of days it takes for a company to sell its products, the riskier the company is.
Accounts Receivable Turnover Ratio: The Receivable Turnover Ratio is a financial ratio that measures a company’s efficiency in collecting its accounts receivable from customers. Investors use the Receivable Turnover Ratio to evaluate a company’s ability to collect its accounts receivable efficiently and generate cash flow. A higher ratio indicates that a company is collecting its receivables quickly and efficiently, which can improve its cash flow and overall financial health. In contrast, a lower ratio may suggest that a company is struggling to collect its accounts receivable, which can result in decreased cash flow and increased financial risk.
Days Sales Outstanding (DSO): Also known as Average Collection Period, it measures the average number of days it takes for a company to collect payment from its customers after a sale has been made. A lower DSO indicates that a company is able to collect payment from its customers quickly, which can improve its cash flow and overall financial health, and a higher DSO would indicate otherwise.