AXEHEDGE

Fundamental Analysis: Invest Based on Annual Reports

What can a company’s annual report tell you?

If you’ve read out previous writeups, you’d know how financial analyst heavily relies on the financial sheet of a company to determine its value of a company. If you haven’t, you can find it below:

Beginner’s Guide to Fundamental Analysis

In the same writeup, we have also mentioned how under the fundamental analysis methods, there are generally two ways that analysis is done, qualitative and quantitative. The qualitative method is relatively simpler to do, you’ll just have to find if the company has red flags to be avoided.

Where we are now, is at the main door of the quantitative method. The quantitative method relies heavily on the analysis of how well the company’s performance is, and the annual report is the main key for you to proceed further into the quantitative realm of fundamental analysis.

Why is it important to do quantitative analysis while investing?

Quantitative analysis will provide you with more grounded insights into the prospect of a company. A company may look well if you only screen it under the qualitative approach, but whether it can make money or not is still in the dark. Bringing it to light will require effort and research, that is where the quantitative method comes in.

What are annual reports?

Annual reports are a report provided by a company to its shareholders that details out their activities and finances for the financial year. It can also contain other details pertaining to the market, the management, and whatever it is that they feel like putting in there. You can find it online.

In the U.S., however, there is a mandatory filing of the annual report via form 10-K, which has its own structures and formats, and it can appear a bit different from the annual reports booklet you’d find lying around, but the essential structures are the same. Some companies didn’t even bother to craft those fancy booklets and just hand over their 10-K filings to their shareholders.

In this write-up, we will be using the 10-K as our main reference, but you can still apply it to any kind of annual report you find lying around. The core components are still the same. You can use Apple’s 10-K report as a reference, download it here.

What to look for in an annual report?

Before we get there, let us remind you that calculations in report can be in the form of consolidated statement or a standalone statement.

A consolidated statement is where the calculation takes into account the profit/loss made by all the company’s holdings or subsidiaries.

A standalone statement is where the calculation is only on that particular company without looking into how its holdings or subsidiaries are doing.

There are a few components of an annual report that are important to investors.

1. General Overview

General overview of a company is a part of every financial report that you can find. In the 10-K form, you can find it in the Item 1 Section. Here are the things that will be mentioned in this part:

  • Nature of business.
  • products/services they offer.
  • Subsidiaries owned.
  • Location of operation.
  • Regulations that are binding on them.
  • General risk.
  • Any recent events/seasonal factors affecting business.
  • Highlights on the fiscal years — financial overview, activities overview, any remarkable events for the year.

From this part, you would get a general overview of the company. It’s like a first date where you’re just there to decide if you want to explore further or call it quits.

Here’s a sample of it from Apple’s 2022 10-K Annual Report:

2. Risk

In the 10-K form, this is usually mentioned under Item 1A. This is where you can get an insight into what are the opportunities that lay before the company, what are the risks that may affect your investments, and what are the challenges that they may need to overcome.

Here are the things mentioned in this part:

  • Macroeconomic risk.
  • Industrial risk.
  • Export risk.
  • Business sentiment.
  • Global economic outlook.
  • Local economic outlook.
  • Legal proceedings involving the company.
  • Company’s future expectations.

In this section, it is important that you read it and compare it with the company’s peers, this is to see how well the company is doing compared to its competitors — especially on the aspect of risk.

Some risks are common for the whole industry, like how fuel price volatility is a risk in oil and gas companies, but some risks are unique to the company in particular — like how some oil and gas companies may face the threat of terrorist attack since they operate in dangerous zones.

Here’s a snapshot from Apple’s 10-K:

3. Financial statements

This is the quintessence of an annual report, the main thing that an analyst will look into when conducting their research. In 10-K report, you can find the financial statements in Item 6, where there’s a segment for selected financial data.

There are many kinds of financial statements, but these three should be your focus:

i) Profit and loss statement

  • Revenues.
  • Costs.
  • Expenses.
  • Net profit for a selected period.
  • Earnings per share.
  • Tax depreciation.
  • Usually mentioned under Item 6 in 10-K reports.

A profit and loss statement are vital since it gives you a sense of what to expect from the company in terms of its growth and profitability. Do note that sometimes it isn’t called a profit and loss statement, but if you look into the contents, they are the same thing.

Simply, it tells you how much the company is making, and how much do they spend to get that much. Essentially, what you want to know from here is its earnings per share (EPS).

ii) Balance sheet

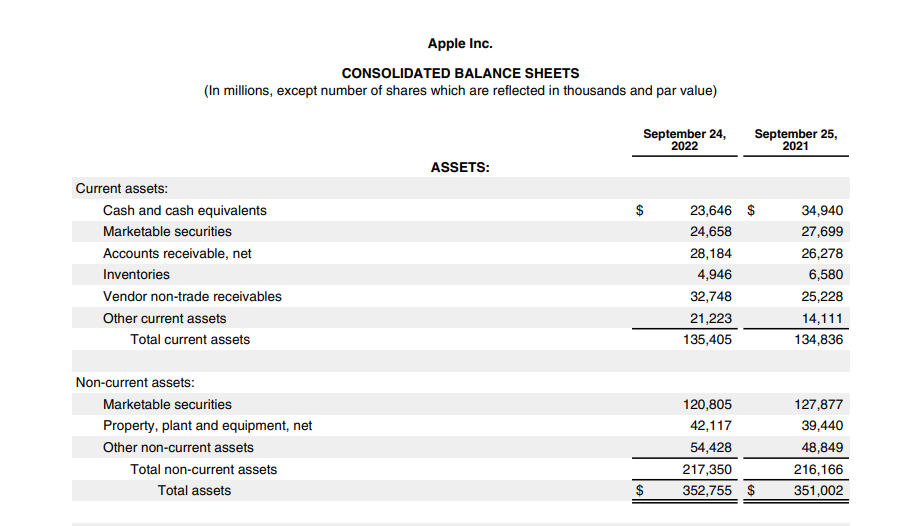
  • Contain details on assets and liabilities.
  • Also mentioned in Item 6, just look for “balance sheet data”

A balance sheet is one of the most important parts of a financial statement which tells you how stable a company in the short-term and long-term run is. An asset that is more than its liabilities is a good sign, but some companies can live with a scary-looking balance sheet, just so you know. So, more assets and liabilities are often good, but sometimes more liabilities than assets isn’t always bad.

3. Cash flow

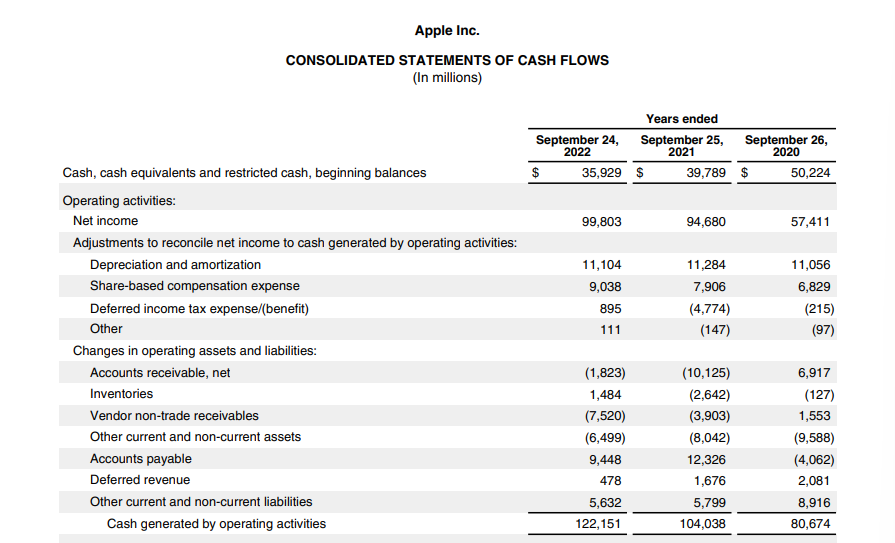
  • Cash flow tells you the total sum of money moving in and out throughout the process.
  • The three main components of a cash flow statement are cash flow from operations, from investing, and from financing.
  • Cash flow from operations refers to the cash flow relating to processes concerning the companies’ core business operations, e.g., McDonald’s selling fast food.
  • Cash flow from investing concerns the cash flow that comes from any investment activities, be it an investment in financial instruments or investments in the form of purchasing machinery and plants — as long as it’s named investment!
  • Cash flow from financing concerns any ins and outs of cash from financial transactions such as payments of dividends, issuance of bonds, raising debts, and so on.
  • Usually mentioned under Item 8 of a 10-K report.

Cash flow is a good indicator of a company’s well-being. It tells you exactly how much the company is making at a relevant time, and it’s by far one of the most transparent way for you to see how the company is doing compared to other financial statements.

For example, if you operate a furniture company, you can either sell it in cash (paid in full) or by credit (paid in installments). Say, you’re paid in credit in the amount of $100,000. That $100,000 may already be reflected in your profit and loss statement despite the full payment haven’t been received yet, your buyer might run away for all we know.

In a cash flow statement, however, it will mention the time frame in which you’re expected to receive that payment — so investors can see if you’re able to pay your short-term debt, etc., or not.

Now before we part

  • You should know the difference between a consolidated statement and a standalone statement.
  • Whenever you skim through a company’s annual report, be sure to check its general overview, its risk segment, and its financial statements.
  • You could at least have a general grasp on how a company is doing.
  • You should generally be able to tell if the company is doing financially well.
  • You can at least see if the company is making a profit.
  • You can at least tell if a company is making proper use of its investments.
  • The most appropriate way to tell all the above, however, is through financial ratios.
  • What on earth is a financial ratio? We will explain that in a later article.

Do keep an eye out for our posts by subscribing to our channel and social media.

None of the material above or on our website is to be construed as a solicitation, recommendation or offer to buy or sell any security, financial product or instrument. Investors should carefully consider if the security and/or product is suitable for them in view of their entire investment portfolio. All investing involves risks, including the possible loss of money invested, and past performance does not guarantee future performance.

Written By

Become a AXEHEDGE investor today.