Hello, and welcome to an article that is a part of our series on fundamental analysis. Just to get you up to speed, here’s what we are up to:
When considering investments or trades, there are generally two approaches used by people to analyze their prospects. These approaches are known as technical analysis and fundamental analysis.
Each approach utilizes different methods to evaluate the worthiness of companies for investment. In this case, we will focus on the fundamental investors, also known as value investors, and their way of evaluating investments.
In a nutshell, fundamental investors seek to identify the intrinsic value of a company. They do this by examining the financial statements of the company, including the Profit & Loss Statement, Balance Sheet, and Cash Flow Statement. For a comprehensive guide on how to read these statements, you can click on the hyperlinks provided.
How do they examine all the financial statements above? By using financial ratios! If you want a general overview of how financial ratios work, check out this article — Fundamental: Introduction to Financial Ratios.
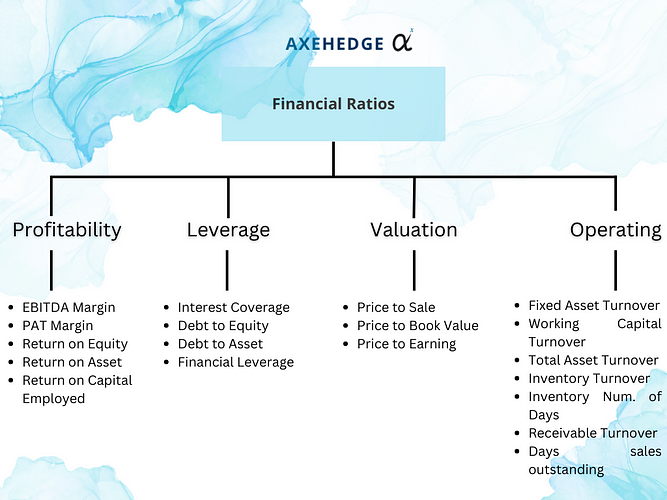
Please also look at the chart below to get a full picture of where we are.
So, we are in the “Profitability Ratio” category while the types of ratios that we are going to discuss for now are the EBITDA Margin and the PAT Margin ratios. Let’s go!
First thing first, what is EBITDA? EBITDA here refers to the earnings of a company before they use that money to pay their interests, tax and before they take into account depreciation and amortization.
Depreciation and amortization here are a concept in accounting whereby both are marked as expenses in a company’s financial statements. Depreciation is where you put a certain cost in each period to mark the deterioration of your fixed assets’ value — say, you have a $10,000 machine that will be useless in 10 years, you can say that its depreciation rate is $1,000 every year for 10 years.
Amortization is quite like depreciation, but it is mostly used for intangible assets like patents, where you’d measure your expenses based on the useful life of your asset. Say, you pay $10,000 to patent your product for 10 years. So, the amortization rate is $1,000 every year until the patent is no more and everyone else can create the same product.
So, what is the EBITDA margin then?
EBITDA Margin is used by investors and analysts to understand how much profit a company is generating from its operations before accounting for interest, taxes, and non-cash expenses such as depreciation and amortization.
It provides insight into a company’s operational efficiency and profitability, as it excludes certain non-operational expenses and financial items that may not directly reflect the company’s core operating performance.
How to calculate EBITDA Margin?
The formula for EBITDA Margin is:
EBITDA Margin = Operating Income + Depreciation + Amortization / Total Revenue * 100
Great, now how the heck do you find all that? They are mentioned in the financial statements of a company.
However, here are a few notes for you:
To get the total revenue, look for how much the company makes without accounting for its tax and interest. Why we’re telling you this is because they don’t always name it “total revenue” in their financial statements, like the example we’re going to show you after this.
Sometimes it’s called revenue, sometimes income, and sometimes sales.
Be careful with the word “net” because usually, it is when interest and tax are already accounted for, however, it’s not always the case (like the example we’re going to see below).
All company financial statements have all the things mentioned above, but different companies arrange these things rather differently, and sometimes the terms are worded differently as well.
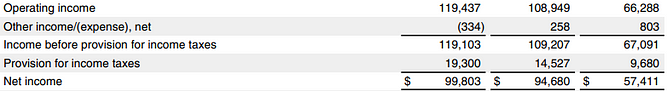
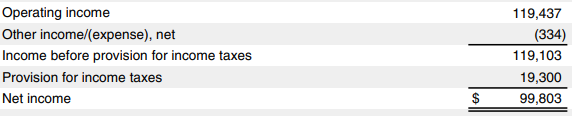
Here, we’ll look at Apple’s 2022 Financial Statement, in which thankfully they have calculated the operating income for us (thanks Apple!).
So, the operating revenue (income) is $119,103 million (their denomination for this chart is in million).
(See up there, “net income” there is when they took income tax into account, we don’t want that. We want the unadulterated income, fresh dollar smell — y’know?)
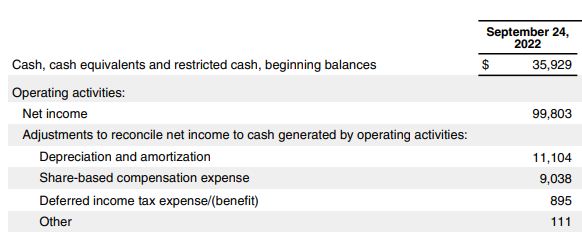
Now, look at the Depreciation and Amortization amount, it’s $11,104 million.
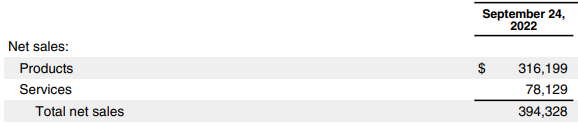
Now it’s time for our last ingredient — the total revenue, i.e., how much the company makes for the year (without deducting tax, interest, and all). So where do you find it in Apple’s Annual Report?
You can find it in the net sales part of the financial statements, $394,328 million. How do we know this is the one? Because how does Apple make money? By selling their gadgets, and providing services like the Appstore, Apple Music, and all those things.
So, they get their revenue from doing that. Now, all the sales they made are their revenue, right? If we’re to make it easy for you, we’ll just say that they’re the same thing, they just name it differently.
Also, notice how this time we take the total net asset despite it having the word “net” on it. The reason is that the word “net” here doesn’t mean that they deducted tax, interest, etc. They’re just telling you how much they made from sales.
Now that we have all of them, let’s put them into our formula:
To know how good that 33.02% is, you should compare it with Apple’s peers’, so assuming there’s a company with businesses in the same area as Apple, and the EBITDA Margin of said company is, say, 30% — then you can say that Apple is performing better by 3.02%.
PAT Margin
The second ratio under the profitability ratio is the Profit After Tax (PAT) Margin or the Net Profit Margin. It is used to assess a company’s profitability and overall financial performance.
It provides insight into the company’s ability to generate profits from its operations, after accounting for all expenses including taxes, and is considered a key indicator of a company’s profitability.
The formula for PAT Margin is as follows:
PAT Margin = (Net Profit / Total Revenue) x 100
Here’s a few notes:
Net Profit refers to the profit of a company after taking into account all expenses including taxes, interest, and non-operating items.
Total Revenue refers to the total sales or revenue generated by a company during a specific period.
Let’s try it again with Apple’s Financial Statement:
The net income for Apple can be found here, where it is $99,803 million.
The total revenue is $394,328 million.
Now we have both the required variables, so let’s just put it into the formula!
PAT Margin = 99,803 / 394,328 * 100
PAT Margin = 25.31%
So, you can say that Apple’s PAT Margin, or Net Profit Margin for 2022 is 25.31%. To know if it is any good, you will have to compare it with Apple’s peers to see which one is higher the higher the PAT ratio of a company, the better it is!
Bottom line
EBITDA Margin is used by investors and analysts to understand how much profit a company is generating from its operations before accounting for interest, taxes, and non-cash expenses such as depreciation and amortization.
PAT Margin or Net Profit Margin is used to assess a company’s profitability and overall financial performance. It provides insight into the company’s ability to generate profits from its operations, after accounting for all expenses including taxes, and is considered a key indicator of a company’s profitability.
EBITDA Margin looks at the company’s Operating Income, Depreciation, Amortization, and Total Revenue.
PAT Margin looks at the company’s Net Profit (profit after deducting all expenses) and its Total Revenue.
Some of the terms above are used differently by companies, but if you understand what the numbers essentially represent, you’ll know which is which.
Do keep an eye out for our posts by subscribing to our channel and social media.
None of the material above or on our website is to be construed as a solicitation, recommendation or offer to buy or sell any security, financial product or instrument. Investors should carefully consider if the security and/or product is suitable for them in view of their entire investment portfolio. All investing involves risks, including the possible loss of money invested, and past performance does not guarantee future performance.