Financial Ratio: Leverage Ratios (Part 1)
Easy way to get Interest Coverage and Debt to Equity ratios.

Hi, and welcome to the third part of our series on financial ratio analysis. Just to get you up to speed, here’s what we are up to:
When considering investments or trades, there are generally two approaches used by people to analyze their prospects. These approaches are known as technical analysis and fundamental analysis.
Each approach utilizes different methods to evaluate the worthiness of companies. In this case, we will focus on the fundamental investors, also known as value investors, and their way of evaluating investments.
Simply, fundamental investors seek to identify the intrinsic value of a company. They do this by examining the financial statements of the company, including the Profit & Loss Statement, Balance Sheet, and Cash Flow Statement. You can click on the hyperlinks provided for a comprehensive guide on how to read these statements.
How do they examine all the financial statements above? By using financial ratios! If you want a general overview of how financial ratios work, check out this article — Fundamental: Introduction to Financial Ratios.
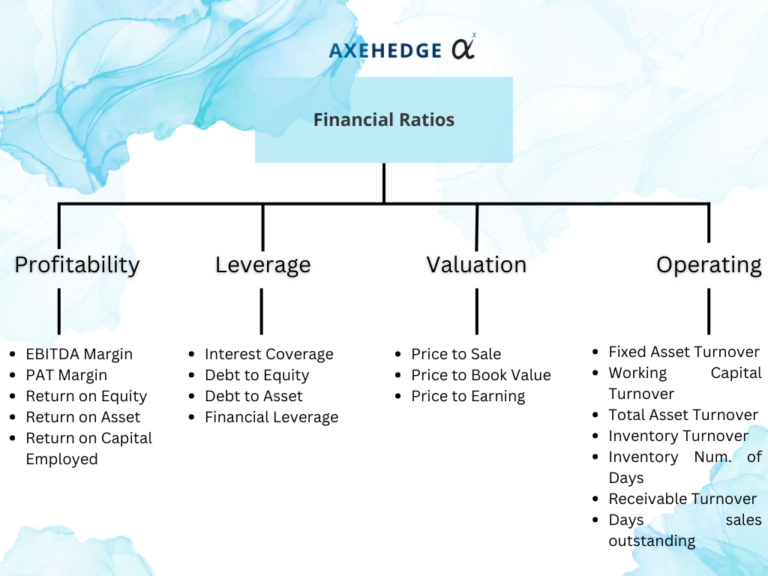
There are four branches of financial ratios available: Profitability, Operating, Leverage, and Valuation.
Please also look at the chart below to get a full picture of where we are.

So, we are in the “Leverage Ratio” category while the types of ratios that we are going to discuss for now are the Interest Coverage and Debt to Equity ratios.
Generally, leverage ratios are financial metrics that measure the level of debt a company uses to finance its operations and investments. They provide investors with an understanding of the company’s ability to meet its debt obligations and how risky its capital structure is.
Before we start, for the examples below, we will use Apple’s annual report (FY2022) which you can download here. There’s no particular reason why, it’s just that Apple’s report is relatively structured and easy to use.
Interest Coverage

The interest coverage ratio is a financial metric that tells investors how easily a company can pay the interest on its outstanding debt using its earnings before interest and taxes (EBIT). A higher interest coverage ratio generally indicates that a company is generating sufficient earnings to cover its interest expenses, which can be a good sign of financial health.
Simply, it tells you how well a company can pay its debts — you don’t want to be buying a company whose directors are being chased by loan sharks.
How to calculate Interest Coverage?
The formula for Interest Coverage ratio is as follows:
Interest Coverage = [Earnings Before Interest and Tax / Interest Payment]
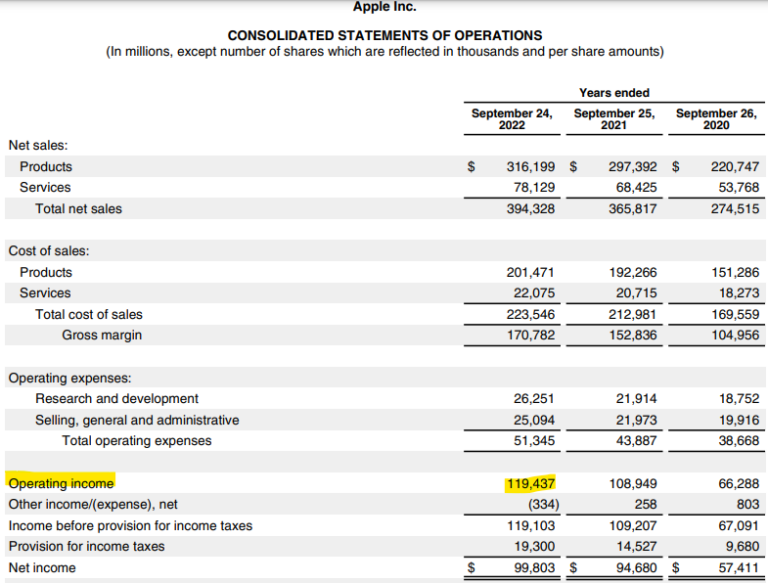
How to get all those things? We’ll look at its financial statements. Whereby you can find the Earnings Before Interest and Tax (EBIT) value in its Statements of Operations which is at $119,437.

Note how we don’t take the income inclusive of its other income or expenses? That’s because “other income / expense” here also includes interest payment. EBIT is before interest and tax — we want it raw! How did we know other expenses here include interest payment? Look at the Interest Payment part below.
As for its Interest Payment, we can have a look at the note to Apple’s financial statements (Note 4), in which it details out the “interest expense” of Apple at $2,931 million. (See how it puts interest payment under “other income/expense”? That’s why we don’t consider this when looking for EBIT).

Now that we have all of them, let’s put them into our formula:
Interest Coverage = [Earnings Before Interest and Tax / Interest Payment]
Interest Coverage = 119,437 / 2,931
Interest Coverage = 40.75
Note: The Interest Coverage ratio is expressed in whole number, in which 40.75 here can simply be understood as Apple makes 40.75 times more than it has to pay for its interest.
Now that you get this, you can’t make a decision yet. What you must do is look into Apple’s other ratios to see how well Apple is generally doing, and also compare this ratio with Apple’s peers’ ratios to get a sense how well is Apple doing compared to its competitors.
Debt to Equity

Debt to Equity ratio tells investors how much debt a company is using to finance its operations compared to its equity. A high debt-to-equity ratio generally indicates that a company is relying heavily on debt to finance its operations, which can make it riskier for investors. This is because the company may have difficulty meeting its debt obligations if it experiences financial difficulties or a downturn in its business.
Simply, it tells you how the company runs its business — by relying heavily on debt or other means of funds.
How to calculate Debt to Equity?
The formula is as follows:
Debt to Equity = Total debt / Total equity
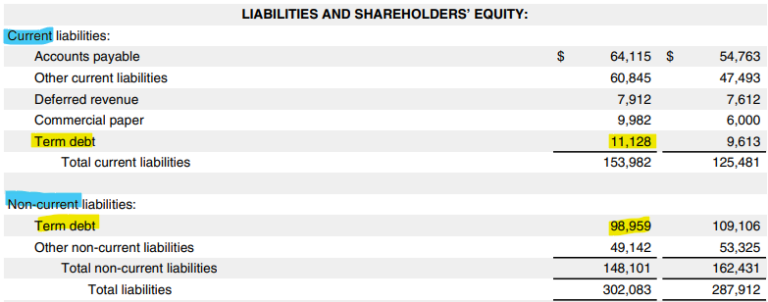
Now, let’s look for all the values required. As for Total Debt, you can look for it in Apple’s Balance Sheets under its liabilities section. As you can see below, we must take the “term debt” under both current (which means short-term) and non-current (which means long-term) liabilities section to get the total debt.

So, 11,128 + 98,959 = 110,087.
Apple’s total debt is $110,087 million.
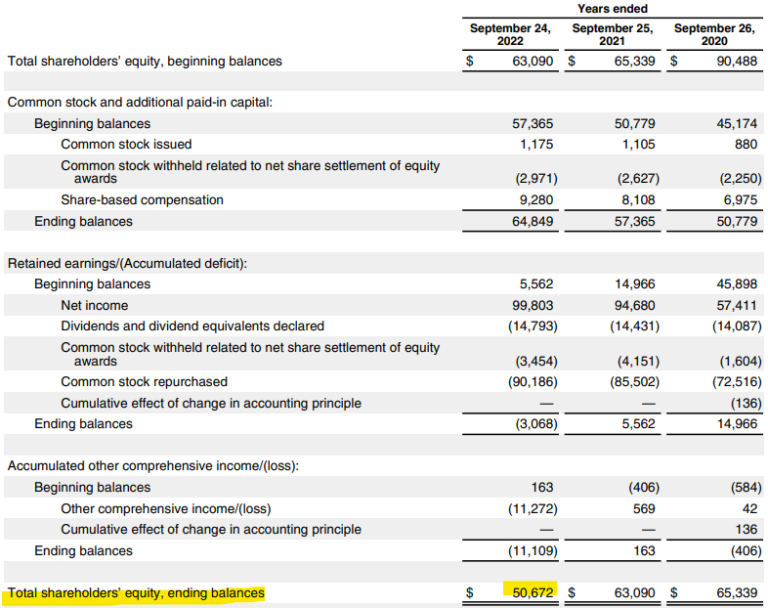
Now, let’s get to its Total Equity, which is at $50,672 million if you look at Apple’s Statement of Shareholders’ Equity.

Now that we have all of them, let’s put them into our formula:
Debt to Equity = Total debt / Total equity
Debt to Equity = 110,087 / 50,672
Debt to Equity = 2.17
So, from the ratio above, we can understand that for every 1 equity Apple has, it also has 2.17 times more debt. It shows that Apple relies on debt to run its business, but you can’t tell yet if Apple is a good or bad business just by this one single ratio.
What you must do is look into Apple’s other ratios to see how well Apple is generally doing, and also compare this ratio with Apple’s peers’ ratios to get a sense how well is Apple doing compared to its competitors.
Bottom line
- The Interest Coverage ratio tells investors how easily a company can pay the interest on its outstanding debt using its earnings before interest and taxes (EBIT).
- The debt-to-equity ratio is a financial metric that tells investors how much debt a company is using to finance its operations compared to its equity.
- A higher interest coverage ratio generally indicates that a company is generating sufficient earnings to cover its interest expenses, which can be a good sign of financial health.
- A high debt-to-equity ratio generally indicates that a company is relying heavily on debt to finance its operations, which can make it riskier.
- All these ratios should be analyzed in conjunction with other financial metrics and factors before making any investment or business decisions.
Do keep an eye out for our posts by subscribing to our channel and social media.
None of the material above or on our website is to be construed as a solicitation, recommendation or offer to buy or sell any security, financial product or instrument. Investors should carefully consider if the security and/or product is suitable for them in view of their entire investment portfolio. All investing involves risks, including the possible loss of money invested, and past performance does not guarantee future performance.


