How to calculate the Price-To-Book-Value ratio, a step-by-step guide.
Just to get us up to speed, when considering investments or trades, there are generally two approaches used by people to analyze their prospects. These approaches are known as technical analysis and fundamental analysis.
Each approach utilizes different methods to evaluate the worthiness of companies. In this case, we will focus on the fundamental investors, also known as value investors, and their way of evaluating investments.
Simply, fundamental investors seek to identify the intrinsic value of a company. They do this by examining the financial statements of the company, including the Profit & Loss Statement, Balance Sheet, and Cash Flow Statement. You can click on the hyperlinks provided for a simple guide on how to read these statements.
How do they examine all the financial statements above? By using financial ratios! If you want a general overview of how financial ratios work, check out this article — Fundamental: Introduction to Financial Ratios.
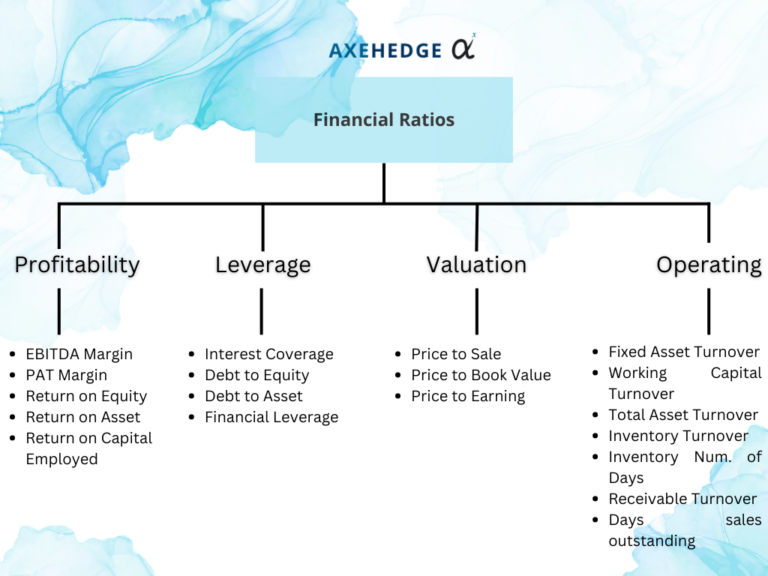
Before this, we discussed three out of the four branches of financial ratios: There are four branches of financial ratios available: Profitability, Operating, Leverage, and Valuation — we are currently looking at a branch under valuation ratio.
Here’s a chart of (almost) everything under the financial ratio:
Price to Book Value (PBV)
The Price-to-Book Value (P/BV) ratio is a financial ratio that compares a company’s market price per share to its book value per share. It provides insights into how the market values a company relative to its net assets or shareholders’ equity. A lower Price-to-Book Value ratio generally indicates that a company’s stock is considered relatively undervalued compared to its net assets.
However, it’s important to consider industry norms, company-specific factors, and compare the ratio with peers before making investment decisions. The Price-to-Book Value ratio is just one factor to consider in a comprehensive analysis of a company’s financial health and valuation.
How to calculate Price to Book Value (PBV)?
Before we start, for the examples below, we will use Apple’s annual report (FY2022) which you can download here. There’s no particular reason why, it’s just that Apple’s report is relatively structured and easy to use.
Also, in the real-life application, it’s advisable for you to use the latest available data, based on their latest report, but since ours is just to educate on how to calculate it, we use an a-bit-outdated FY2022 Annual Report.
The formula for the PBV ratio is as follows:
Price-to-Book Value Ratio = Market Price per Share / Book Value per Share
Where,
Book Value per Share = Book value / outstanding shares
So, how do you calculate Book Value?
Book Value = Assets — Liabilities
Then, here’s how the full formula would look like:
Price-to-Book Value Ratio = Market Price per Share / [ (Assets — Liabilities) / outstanding shares]
Now let’s get down to the numbers.
First, Market Share Price — it refers to the current price of a share in the company. You can just search for it online, so here’s Apple’s which is at $174.20:
Now, let’s get down to its Book Value Per Share.
Based on the formula, we have to look for three things — its assets, liabilities, and outstanding shares. Now here’s where you actually should look into its latest data, especially for outstanding shares, but for educational purposes we just took the data from Apple’s FY2022 Annual Report (which is filed in September 2022).
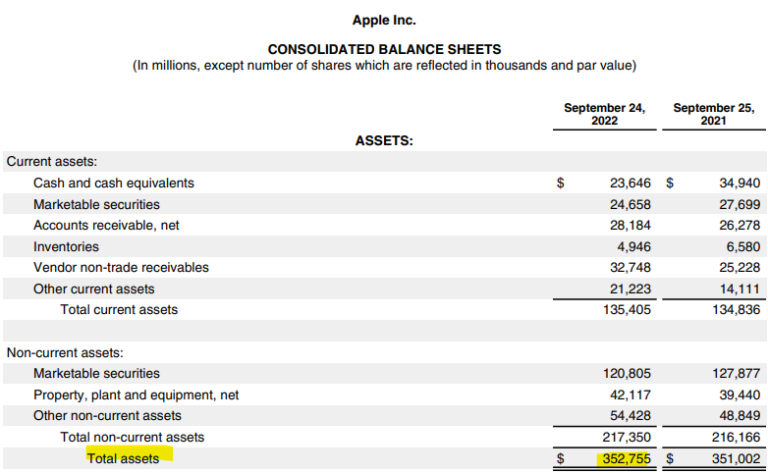
If we look into Apple’s financial statements, all assets, liabilities, and outstanding shares are mentioned in the balance sheet, (but for the outstanding shares, refer to the notes regarding shareholder’s equity to get the accurate numbers):
Asset = $352,755,000,000
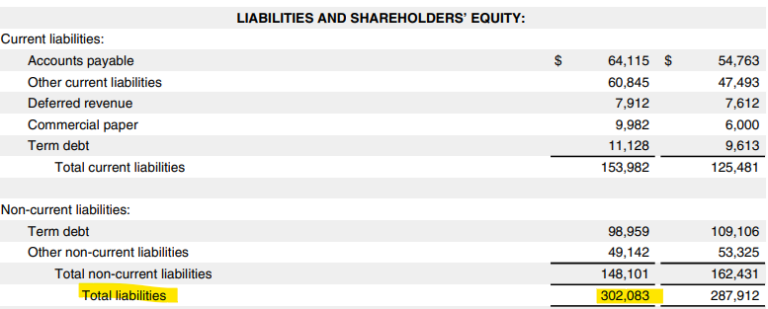
Liabilities = $302,083,000,000
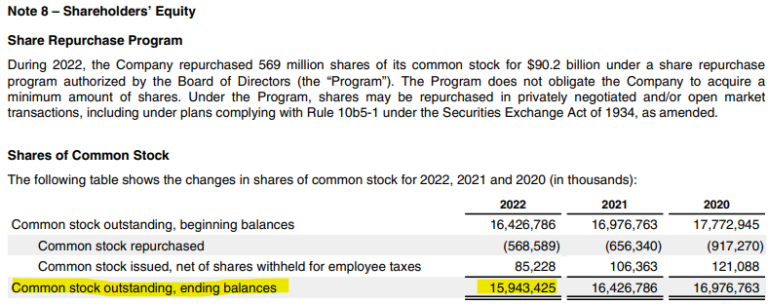
Outstanding shares = 15,943,425,000 units
Now, let’s get to the original formula and put in all of these values:
Price-to-Book Value Ratio = Market Price per Share / [ (Assets — Liabilities) / outstanding shares]
Price-to-Book Value Ratio = 174.2 / [ (352,755,000,000–302,083,000,000) / 15,943,425,000]
Price-to-Book Value Ratio = 174.2 / 3.17823805111
Price-to-Book Value Ratio = $54.81
Note, however, that the value above IS NOT accurate. Why? Because we use the latest price of Apple’s shares (as of May 23rd, 2023), but we use a rather outdated data for its shares outstanding value, etc., because it’s easier for us to reference the actual financial statement, but as far as the calculation is concerned, that’s how you do it.
Bottom line
The Price-to-Book Value (P/BV) ratio is a financial ratio that compares a company’s market price per share to its book value per share.
A lower Price-to-Book Value ratio generally indicates that a company’s stock is considered relatively undervalued compared to its net assets.
Price-to-Book Value Ratio = Market Price per Share / [ (Assets — Liabilities) / outstanding shares]
Most of the values needed to calculate the PBV ratio can be found in the Balance Sheet.
The PBV ratio is just one tool that investors can use to evaluate a stock.
It is important to consider other factors, such as the company’s earnings, growth prospects, and risk profile, before making an investment decision.
Do keep an eye out for our posts by subscribing to our channel and social media.
None of the material above or on our website is to be construed as a solicitation, recommendation or offer to buy or sell any security, financial product or instrument. Investors should carefully consider if the security and/or product is suitable for them in view of their entire investment portfolio. All investing involves risks, including the possible loss of money invested, and past performance does not guarantee future performance.