Get to know Return on Asset and Return on Capital Employed
Back with our series on fundamental analysis. Just to get you up to speed, here’s what we are up to:
When considering investments or trades, there are generally two approaches used by people (or AI, we don’t discriminate) to analyze their prospects. These approaches are known as technical analysis and fundamental analysis.
Each approach utilizes different methods to evaluate the worthiness of companies for investment. In this case, we will focus on the fundamental investors, also known as value investors, and their way of evaluating investments.
Fundamental investors seek to identify the intrinsic value of a company. They do this by examining a company’s financial statements, including the Profit & Loss Statement, Balance Sheet, and Cash Flow Statement. You can click on the hyperlinks provided for a comprehensive guide on how to read these statements.
How do they examine all the financial statements above? By using financial ratios! If you want a general overview of how financial ratios work, check out this article — Fundamental: Introduction to Financial Ratios.
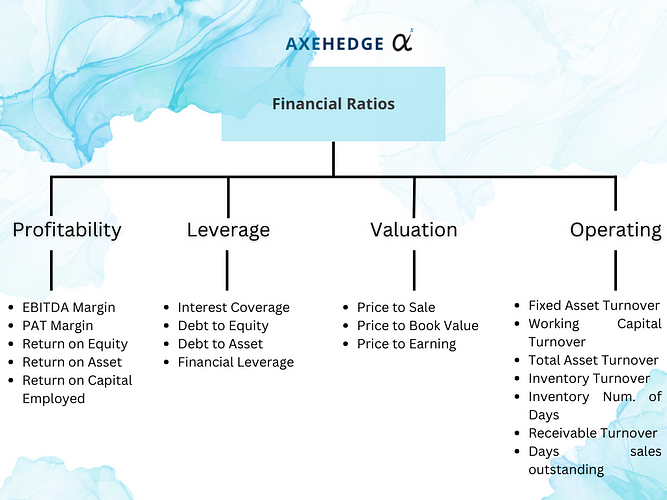
Please also look at the chart below to get a full picture of where we are.
So, we are on the “Profitability Ratio” category while the types of ratios that we are going to discuss for now are Return on Asset (ROA) and Return on Capital Employed (ROCE).
Return on Assets (ROA) is a financial ratio that measures how efficiently a company is using its assets to generate profit. It is expressed as a percentage and indicates the company’s ability to generate earnings from its total assets.
In simple terms, ROA tells investors how much profit a company is making for every dollar of assets it has. It provides insight into how effectively a company is utilizing its assets to generate earnings, regardless of the source of financing (debt or equity). A higher ROA generally indicates better asset utilization and profitability, while a lower ROA may suggest inefficient asset utilization or lower profitability.
For example, if a company has an ROA of 10%, it means that for every $100 of assets it has, it generates $10 in profit. If another company has an ROA of 5%, it means that for every $100 of assets it has, it generates $5 in profit.
ROA is a useful tool for investors to assess a company’s overall operational efficiency and profitability, and to compare it with industry peers or historical performance. It can help investors make informed decisions about a company’s financial performance and growth prospects and evaluate its ability to generate profits from its assets.
However, it’s important to consider other financial ratios and factors in conjunction with ROA to get a comprehensive understanding of a company’s financial health and performance.
How to calculateReturn on Asset?
The formula for ROA is as follows:
ROA = Net Income / Total Assets; or
ROA = [Net income + Interest*(1-tax rate) / Average Total Assets
We’ll see how it works in real life in a bit. Just to let you know, the examples below will be based on Apple’s 2022 Annual report which you can download here.
Now, the two formulas above will each bring you different results. The latter is more accurate as it takes into account the interest as part of a company’s return (the reason behind that is debtholders are considered as stakeholders in the company, so, any payments made to them are also a payment made to stakeholders).
However, not all financial reports would be suitable (or at least can be efficiently calculated) with the second formula. Some companies are exposed to multiple levels of taxes, such as Apple who is paying around 3 different types of tax.
In the end, what you need is to get this ratio and use it to compare it with other companies’ ratio. So, what you need to make sure is that you’re using the same formula when calculating the ROA for all the companies that you want to compare.
As for this situation, we will use the first formula.
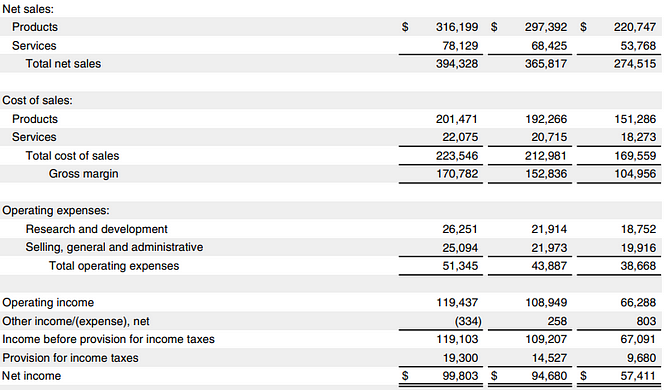
First, look for Apple’s Net Income, which is mentioned in its financial sheet, in its statement of operations.
As we can see, the value as of September 2022 is $99,803 million.
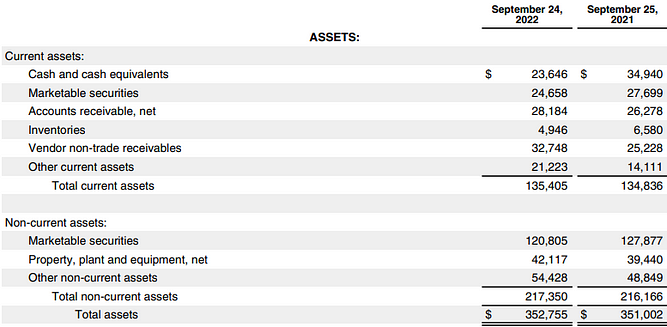
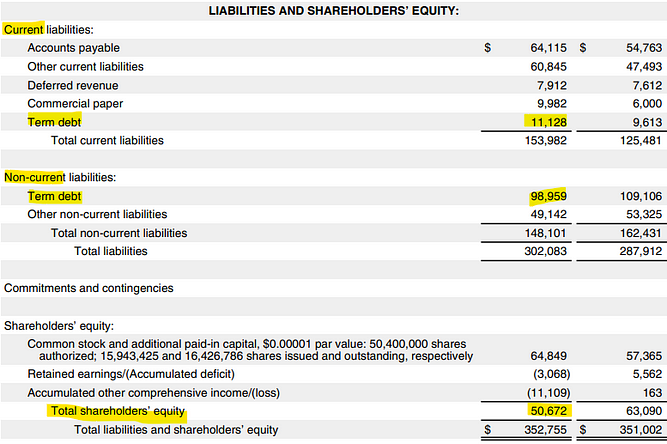
Next, look for its Average total assets, which we can find in its balance sheet.
If you look, as of September 2022, the total asset is $352,755 million.
Now, calculate it per the formula:
ROA = Net Income / Total Assets
ROA = 99,803 / 352,755
= 0.28292440929
Now, turn it into a percentage by multiplying it with 100.
0.28292440929*100 = 28.29%
So, Apple’s ROA as of September 2022 (Apple’s financial year ends in September) is 28.29%!
Return on Capital Employed (ROCE)
What isReturn on Capital Employed (ROCE)?
Return on Capital Employed (ROCE) is a financial ratio that measures a company’s profitability in relation to the capital it uses to generate earnings. It is expressed as a percentage (%) and provides insight into how efficiently a company is utilizing its capital to generate profits.
In simple terms, ROCE tells investors how much profit a company is making for every dollar of capital employed in its operations. Capital employed includes both equity and debt, and it represents the total investment made in a company’s operations. ROCE considers both equity and debt financing, which makes it a more comprehensive measure of profitability than some other ratios that only consider equity.
A higher ROCE generally indicates better profitability and efficient capital utilization, while a lower ROCE may suggest lower profitability or inefficient capital utilization. ROCE is often used to assess a company’s ability to generate profits from the capital invested in its operations.
For example, if a company has an ROCE of 15%, it means that for every $100 of capital employed, it generates $15 in profit. If another company has an ROCE of 10%, it means that for every $100 of capital employed, it generates $10 in profit.
ROCE is a useful tool for investors to assess a company’s profitability in relation to the capital invested in its operations, and to compare it with industry peers or historical performance. It can help investors make informed decisions about a company’s financial performance and evaluate its ability to generate profits from the capital it has employed in its operations.
Again, it’s important to consider other financial ratios and factors in conjunction with ROCE to get a comprehensive understanding of a company’s financial health and performance.
How to calculateReturn on Capital Employed (ROCE)?
The formula for ROCE is as follows:
ROCE = EBIT / Overall Capital Employed
Where:
Overall Capital Employed = Short Term Debt + Long Term Debt + Equity
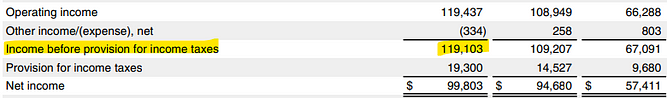
From Apple’s statement of operations, you can find its Earnings Before Interest & Tax (EBIT) here. Note that sometimes different companies use different terms in their reports. Here, we get that its EBIT is $119,103 million.
Now it’s time to look for its Overall Capital Employed, which is the sum of all its debts and equity, you can find it in the balance sheet, whereby the term debts under current liabilities refer to short-term debt, and the one under the non-current liability is long-term debt. Sum up all the three and we’ll have $160,759 million.
Now, let’s get down to the formula!
ROCE = EBIT / Overall Capital Employed
ROCE = 119,103 / 160,759
ROCE = 0.74087920427
Now, turn it into a percentage by multiplying it with 100.
ROCE = 74.09%
Bottom line
ROA is used to measure how efficiently a company is using its assets to generate profit.
ROCE is used to measure a company’s profitability in relation to the capital it uses to generate earnings.
For ROA and ROCE, the results may vary based on the formula that you use, but what’s important is that you use the same formula for all the companies you want to compare.
The result that you get will then be compared with other companies ROA or ROCE, whichever is higher is better (but not exactly so, refer below).
Just because a company’s ROA or ROCE is better than others, it doesn’t mean that the company is good. You need to look at other ratios as well to make sure that it is indeed a buy.
Do keep an eye out for our posts by subscribing to our channel and social media.
None of the material above or on our website is to be construed as a solicitation, recommendation or offer to buy or sell any security, financial product or instrument. Investors should carefully consider if the security and/or product is suitable for them in view of their entire investment portfolio. All investing involves risks, including the possible loss of money invested, and past performance does not guarantee future performance.