AXEHEDGE

Financial Ratio: Profitability Ratios (Part 2)

Return on Equity (ROE) made easy!

Hello, and welcome to an article that is a part of our series on fundamental analysis. Just to get you up to speed, here’s what we are up to:

When considering investments or trades, there are generally two approaches used by people (or AI, we don’t discriminate) to analyze their prospects. These approaches are known as technical analysis and fundamental analysis.

Each approach utilizes different methods to evaluate the worthiness of companies for investment. In this case, we will focus on the fundamental investors, also known as value investors, and their way of evaluating investments.

Fundamental investors seek to identify the intrinsic value of a company. They do this by examining the financial statements of the company, including the Profit & Loss Statement, Balance Sheet, and Cash Flow Statement. For a comprehensive guide on how to read these statements, you can click on the hyperlinks provided.

How do they examine all the financial statements above? By using financial ratios! If you want a general overview of how financial ratios work, check out this article — Fundamental: Introduction to Financial Ratios.

If you missed the first part of our article on Profitability Ratio which covers EBITDA Margin and PAT Margin, do check it out here: Financial Ratio: Profitability Ratios (Part 1).

Please also look at the chart below to get a full picture of where we are.

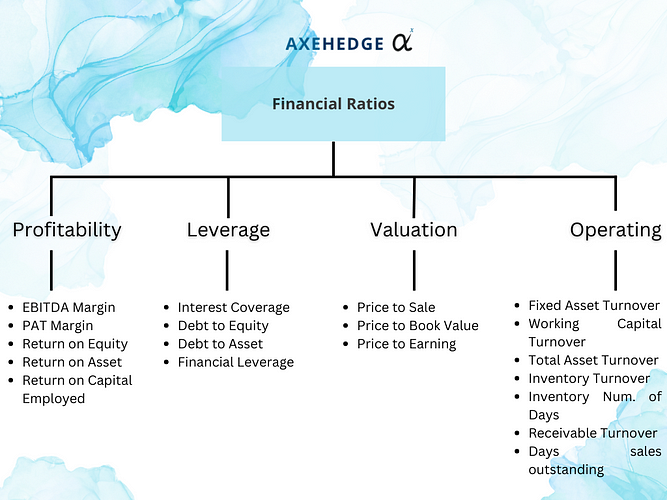
So, we are on the “Profitability Ratio” category while the types of ratios that we are going to discuss for now is Return on Equity (ROE).

What does Return on Equity tell investors?

ROE is used by investors and analysts as a key indicator of a company’s ability to generate returns on the shareholders’ equity invested in the business. It provides insight into how effectively a company is utilizing shareholders’ equity to generate profits and create value for shareholders.

A higher ROE generally indicates that a company is generating higher profits relative to the shareholders’ equity, which may suggest stronger profitability and efficiency in utilizing shareholders’ investment. Conversely, a lower ROE may indicate lower profitability and potential inefficiency in utilizing shareholders’ equity.

What do I do when I find a company's Return on Equity?

Investors use ROE to assess a company’s profitability and efficiency trend over time. You can compare it with industry peers and evaluate the company’s overall financial performance.

A consistently high ROE may indicate a company with a strong competitive advantage, effective management, and efficient use of shareholders’ equity. However, it’s important to consider the specific industry and company context and use ROE in conjunction with other financial ratios and metrics for a comprehensive assessment of a company’s financial health.

How to calculate Return on Equity?

The formula for ROE is as follows:

ROE = Net Income / Average Shareholders’ Equity

So, here are the things that you need to look for in the company’s financial statement — its Net Income and its Average Shareholders’ Equity.

By the way, we are using Apple’s 2022 financial statement as our sample. You can find it here.

Let’s go to the first one, net income — you can find it in the cash flow statement, we have $99,803 million.

As for average shareholder’s equity, we can find it in the balance sheet, where it puts $50,672 million for 2022 and $63,090 million for 2021.

So, what you need to do is put them in the formula, but to make it easier, we’ll calculate the average shareholders’ equity first, which is as follows:

[50,672 + 63,090] / 2 = 56,881

Now, let’s churn it into the big formula:

ROE = Net Income / Average Shareholders’ Equity

ROE = 99,803 / 56,881

ROE = 1.7545929…

Or change it to a percentage by multiplying with 100, and you’ll get:

ROE = 175.46%

That’s it! Yup, pretty simple, isn’t it? Calculating ROE is surely simple, but actually knowing if it’s good or not might not be the case. Why? We’ll

How can ROE deceive you?

As you can see, on seeing how well-utilized a company’s equity is, the ROE uses shareholders’ equity in its formula. Although, that can be quite deceiving. How so?

Let’s take a simple analogy. You want to open a company that provides design services. There are a few ways in which you can run your business. Let’s assume to run this business all you need is a laptop that costs $1,000 — and let’s also assume that in the first year, you managed to make $100 (sheesh).

You can either buy the laptop yourself, which makes the shareholder equity of the company $1,000, in which you are said shareholder.

In this case, the ROE will be as follows:

100 / 1,000 * 100 = 10%

Cool! Now, let’s imagine that in buying the laptop, you took a debt from your friend in the sum of $900 (debt — not asking him to invest), and the $100 is from your own money. Now, the shareholder’s equity in your company is just $100, meanwhile, the $900 is all just debt.

See how the calculation is now skewed:

100 / 100 * 100 = 100%.

Holy cow! It’s 100% ROE. Unsuspecting investors would think that you are really making big money when in reality, the difference between the 10% ROE and 100% ROE is only the proportion of debt in your company — you’re still making $100 annually, which is normally a mark of bad crafts.

To avoid getting bamboozled, some investors take a longer route when calculating their ROE, that is by using the DuPont Model method.

How to use the DuPont model when looking for ROE?

This is actually the longer way of calculating ROE, but given how long it is, you’ll get to see all the variables that are affecting the ROE, so you can tell what sort of mix there in the ROE percentage are you’re seeing.

The formula is as follows:

ROE = (Net Profit Margin %) x (Asset Turnover) x (Equity Multiplier)

Where:

Net Profit Margin (a.k.a. PAT Margin):

This represents the profitability of a company, calculated as net profit divided by total revenue. It indicates the portion of revenue that is converted into profit after accounting for all expenses.

= Net Profit / Total Revenue

Asset Turnover:

This measures how efficiently a company is utilizing its assets to generate revenue, calculated as total revenue divided by average total assets. It reflects the company’s efficiency in generating revenue from its asset base.

= Total Revenue / Average Total Assets

Equity Multiplier:

This reflects the company’s leverage, calculated as average total assets divided by average shareholders’ equity. It indicates the extent to which a company is using debt to finance its operations.

= Average Total Assets / Average Shareholders’ Equity


Net Profit Margin


Now we look for the net profit of $99,803 million which is mentioned in the income statement.

As for its total revenue, you can find the number, $394,328 million, in its statement of operation, whereby Apple names it “Total net sales”.

Now, calculate it:

99,803 / 394,328 = 0.25309640705

Turn it into percentage by multiplying by 100.

Net profit margin = 25.31%


Asset Turnover


We take its total revenue first, which is $394,328 million as per above.

Now we’ll have to look for average total assets, which we will find the numbers that we will use for the calculation in the balance sheet.

Now, to get the average, just take the values of the asset for both years and divide by 2:

Average total asset = [352,755 + 351,002] / 2 = 351,878.5

Now, let’s get to the Asset Turnover:

394,328 / 351,878.5 = 1.12063681072

Also, for asset turnover, there’s no need to turn it into a percentage, so we get ourselves an asset turnover of around 1.12.


Equity Multiplier


For this, we’ve already gotten the average total assets from above, which is $351,878.5 million.

As for average shareholders’ equity, you can find the values in the balance sheet.

The way to get the average is by adding the value for both years and dividing the result by 2.

[50,672 + 63,090] / 2 = 56,881

Now, let’s get to the Equity Multiplier:

351,878.5 / 56,881 = 6.18622211283

Also, for asset turnover, there’s no need to turn it into a percentage, so we get ourselves an asset turnover of around 6.19.


Try calculating the ROE using the numbers above.


Remember the formula:

ROE = (Net Profit Margin %) x (Asset Turnover) x (Equity Multiplier)

25.31*1.12*6.19 = 175.469%.

Compare it with the result from the quick way of calculating the ROE, same, isn’t it? Mind you, the number can be a slightly different due to rounding offs in our calculations.

Bottom line

  • ROE tells you how well-utilized each share in a company is.
  • You will have to compare a company’s ROE with its peers to see how well it is doing.
  • Just looking at the ROE can be deceiving as ROE value can be skewed by technicalities.
  • If you feel like digging deeper behind the ROE value, you can try using the DuPont method.
  • Using the DuPont method, you’ll get the company’s Net Profit Margin, Asset Turnover, and Equity Multiplier.
  • Net profit margin represents the profitability of a company.
  • Asset turnover measures how efficiently a company is utilizing its assets to generate revenue.
  • Equity multiplier reflects the company’s leverage, i.e., the extent to which a company is using debt to finance its operations.

Do keep an eye out for our posts by subscribing to our channel and social media.

None of the material above or on our website is to be construed as a solicitation, recommendation or offer to buy or sell any security, financial product or instrument. Investors should carefully consider if the security and/or product is suitable for them in view of their entire investment portfolio. All investing involves risks, including the possible loss of money invested, and past performance does not guarantee future performance.

Written By

Become a AXEHEDGE investor today.