How do you trade when you see the Morning Star pattern?
talked about how a single day’s candlestick can affect your decisions while trading, and we have also touched on how a 2-days candlestick can do the same. Now, it’s time to up our game — and you’d most probably have guessed it right, it’s time for 3 days’ candlesticks!
Before we start, if you have absolutely no idea how the price charts work in trading (stocks, forex, etc.), check out our article below!
we’ll make it clear that these patterns are identified throughout the many repetitive occurrences — for example, this one right here is a bullish pattern, which tells you that the price might move up, so there are many instances where price moves up after this pattern forms. Is it guaranteed? Sadly, no. In fact, there is no guaranteed way of identifying when exactly the price is going to go up or down.
Then how do traders make money? They can’t guarantee anything as much as you and I, what traders do is that they try to make the best guess possible by maximizing their chances of success. How to maximize your chance of success? By trying to look at other indicators apart from just looking at one single pattern to place your buy and sell.
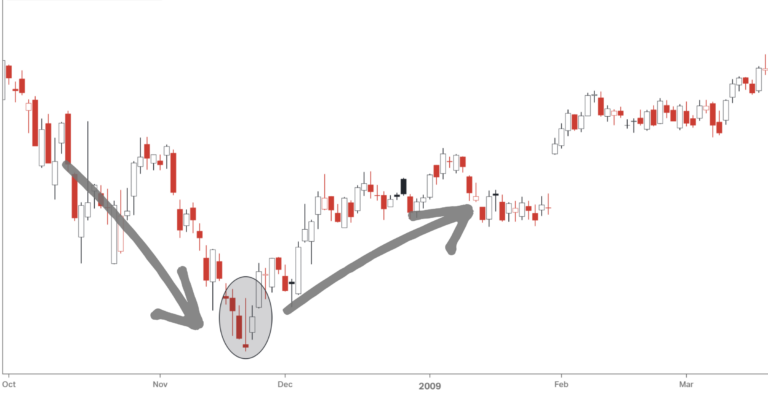
If you see this pattern appearing just as the trend touches the support line, you might have another indicator supporting the guess of the price going up. What is a support line? Read it here. The higher the likeliness will be if you have more indicators supporting the same sentiment.
Characteristics of The Morning Star
Here’s how you can identify a morning star candlestick.
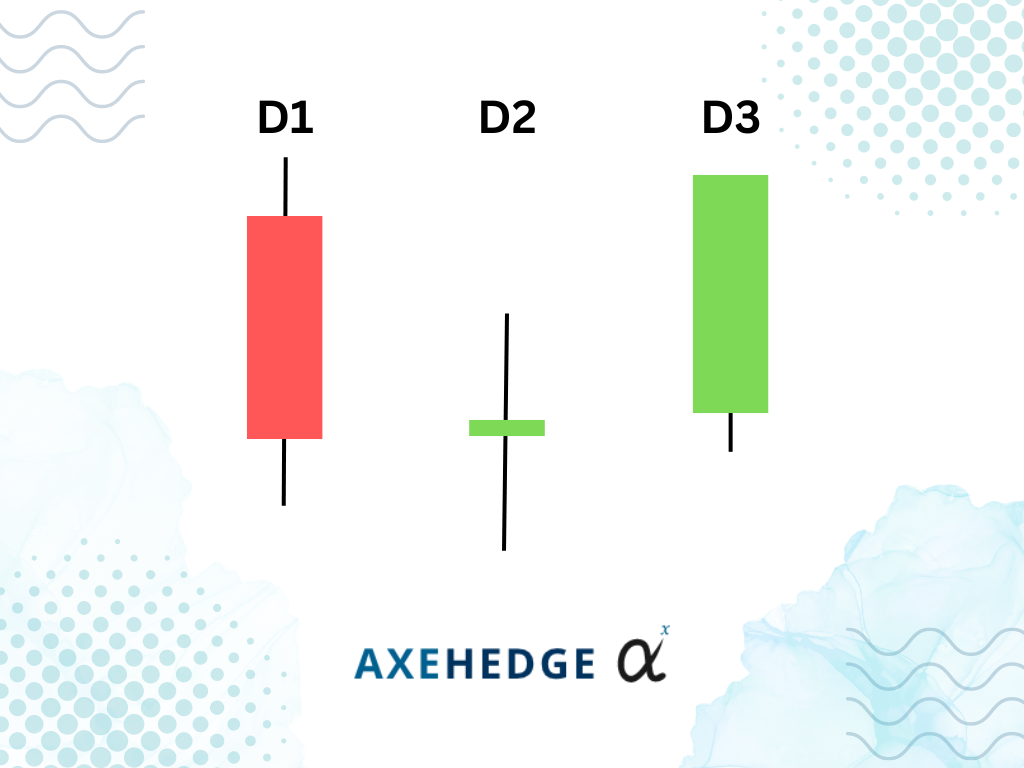
It appears in a downtrend.
First day (D1) candlestick opens at the lowest point in the downtrend and ends up being the new low (red candlestick).
Second day (D2) opens even lower, and it forms either a Doji candlestick or a spinning top candlestick.
Third day (D3) opens higher than D2’s opening price, and ends up even higher to form a green candle.
Should D3 candle close higher than D1’s open? Theoretically, it doesn’t have to (just like the image above), but practically, a safer bet is when D1 closes higher than D1’s opening price.
What does the Morning Star tell you?
Here are your takeaways when you see the pattern forming:
It appears in a downtrend, so it tells you that the current market sentiment is bearish, where people keep on selling and the price keeps falling.
When D1 appears, it further proves that the sentiment is bearish — a new record low!
Just when you thought things couldn’t get any worse, D2 opens lower! It further proves that the sentiment is sell, sell and sell.
But D2 candlestick ends up shaping a Doji or a Spinning Top candlestick — which, if you read our previous articles, is a sign of indecisiveness — it means that the market is contemplating their next direction — traders are in a panic.
If that’s not enough for you to decide, D3 then appears, and it shows that the price is indeed moving up. At this point, the traders who are indecisive on D2 will start to panic and buy (or end their short sell), which would then drive the price up — bullish sentiment enters the group chat.
How to trade?
There are generally two ways in which you can approach a trade, by playing it risky or by being risk averse.
Risky:
If you’re a risk-taker, what you can do is buy at D3’s closing time (which is around 4pm). However, be sure to observe these three conditions — first, D1 is a red candle. Second, D2’s candle opens with a gap (lower) and ends up in a Doji or Spinning Top. Third, D3’s opening price is a gap upwards, and the market price (near closing time) is near to or higher than D1’s opening price.
Stop loss should be put at whichever is the lowest point within all three days (including the tail).
Risk Averse:
If you’re a risk-averse trader, you might want to wait until it’s near the closing time of the next day (Day 4) to see if the price on the third day is bullish. You might want to buy it before the market closes if it is. However, most people would just buy on D3, since D3 itself acts in a way that it confirms D2.
Stop loss should be put at whichever is the lowest point within all three days (including the tail).
Bottom line
The Morning Star is a bullish pattern that indicates the price may go up.
It appears at the bottom of a downtrend, which is then followed by indecisiveness, which is then followed by a green candle that drives people’s sentiment upwards.
Essentially, it tells you “Look! The price moves up after people contemplated.”
A risky trader would place their trade on D3, while a risk-averse one would wait until D4 to confirm if the sentiment is bullish — although D3’s trading is relatively already at a lower risk.
Use other indicators and analysis as well to get a proper overview of what’s going on — it will help you make more informed decisions.
Do keep an eye out for our posts by subscribing to our channel and social media.
None of the material above or on our website is to be construed as a solicitation, recommendation or offer to buy or sell any security, financial product or instrument. Investors should carefully consider if the security and/or product is suitable for them in view of their entire investment portfolio. All investing involves risks, including the possible loss of money invested, and past performance does not guarantee future performance.