
Support And Resistance: The Basics of Identifying Support and Resistance
How to measure support and resistance

In our previous article, we discussed the basics of Support and Resistance, in which Support and Resistance (S&R) are used by technical analysts or traders in order to know at which price point would the buy or sell sentiment peaks, thus driving the price up or down.
If we want to put it simply, imagine you’re a cheese merchant. You trade cheese. You buy many wonderful cheeses from all over the world, and you sell them. There would be a certain price where the cheese would be considered as way too cheap that it’s stupid if you don’t buy it at that price — and at that point, you and other cheese merchants would buy, buy, and buy — until the price rise again because the buying demand is overflowing.
There would also be a point of price where the price of cheese is too high, and you might think if it goes any higher, no one is going to buy from you. So, you and many other cheese merchants began selling your cheeses to customers in order to gain the most profit (by selling the cheese at its highest possible price). Thus, the selling activity drives the price down, as customers have more price options from the many merchants who’re selling their cheeses.
So… what are support and resistance used for?
Traders would usually use support and resistance to identify the two price points mentioned above, and they will usually put the resistance level as a point that they will start selling their positions (such as shares) and make a profit. The support level will usually be used by short sellers to set their profit-taking and is used by normal traders to start buying.
How does it work IRL? We’ll get to that.
How to measure support and resistance

1. Remember this.
- Before we start, there are many ways you can identify support and resistance levels, and sometimes all it takes is a mere observation and you can see it with your very own eyes.
- S&R doesn’t guarantee you anything, or else I’ll be roaming around in Maybachs and won’t even be bothered with writing this article — but you can always inch closer to getting the highest chance of success.
- S&R is more like a zone, so if the support line is at $10, the support level could as well be $11 or $9, somewhere around the area.
- There are many ways that traders can set their profit-making price, this is not the only way of doing it.
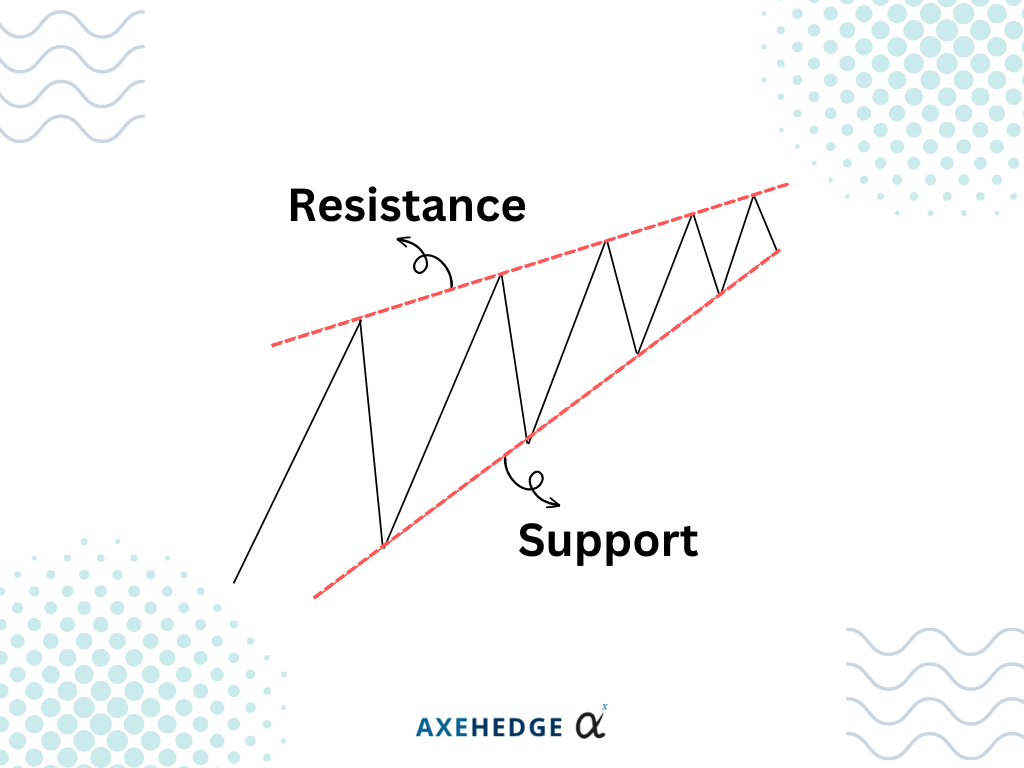
- Here’s the most important one, if you see that the line is drawn above the current price, it is considered the resistance level, and if it’s drawn below the current price. It is the support level.
2. Load your chart.
First, you can’t draw on your chart without even having a chart to begin with. So, let’s load your chart. Now, what about the time frame? How further back should I look?
If you’re a swing trader, you’d most likely look at a long-term time frame, if you’re an intraday or Buy Today Sell Tomorrow (BTST) trader, you’re more likely to need the short-term one.
How long is long, and how short is short?
A short-term chart would usually load data for a period of around 3–6 months.
A long-term chart would usually load data for a period of around 12–18 months.
Just to illustrate it, we’ll look into the short-term graph of Amazon (NASDAQ: AMZN) from around November 2022 to May 2023.

3. Find at least 3 price actions.
The next step is to look for at least three price action points that are almost approximately within the same time frame of each other. If you’re wondering what a price action is, it is a point in the graph where the price moves either from an uptrend to a downtrend or from a downtrend to an uptrend. Basically, a point where the trend shifts.
Do note, that in real life it is hard to get a picture-perfect graph, so you’ll have to make do and approximate things.
Now, in our example, we identified the price action points in the place we circled.

4. Make sure that the price is well aligned and draw a line.
Now, what you need to do is make sure you can draw a straight line through the price action points.

Now we have a line! Is it a support line or a resistance line? Well, let’s look at the current price of Amazon’s shares. If you can’t see it because it’s kind of small, it is $103.20. As for the line, it touches the low point of Amazon’s latest candlestick at $101.15.
So, what we know now is that the current price is higher than the price that the line touches, which means that the line is a support line.
5. Do the same thing for another one.

We’re lazy, so if you’ve got one (in this case you get the support level), then do the same thing to look for its resistance level. Actually, it should have ended here, but if you are super lazy, you can move to the next step.
6. Draw a horizontal line.
We are super lazy, so we draw a horizontal line using the “horizontal line” function in the charting software that we use (we use Koyfin in this example — not paid to write this) so that we can determine the current S&R level by looking at where the line touches (and they actually tell you the price level).

See how that little green and black box on the right-hand side of the screen tells us the price that the line is at? Cool, isn’t it?
Making a well-informed decision
As discussed, the support level is where the buy sentiment would usually rally up, bringing the price upwards, and the resistance level is where the selling sentiment is strong as to cause the price to fall. However, nothing is guaranteed in finance. It can look exactly like your textbook example and take a completely different turn.
There is no 100% guarantee when it comes to investing and trading. However, there’s a thing called minimizing your risk of failure a.k.a. maximizing your potential for success. One of the most common ways to do it is by looking for other indicators that confirm the trend.
For example, the price moves around the support level, which means that usually this is when the buying sentiment is strong, and then you saw that the candlestick forms a piercing pattern which is a sign of a bullish movement. Now there are two signs pointing in the same direction.
Bottom line
- S&R is important for you to know when to set your goal when going long or when short selling.
- S&R does not guarantee that the price will stop going up or stop going down.
- The key is to make well-informed decisions by looking at historical data and trying to corroborate one indicator with a few other indicators pointing in the same direction.
- S&R is not the only way to set your profit-making goal.
- There are short-term and long-term support and resistance level.
- The S&R levels are a zone, not an exact point in price movement.
- The key is to look for three or more price actions that are approximately the same distance from each other — and can be aligned in a straight line.
- After that, draw a line through the price points. Once you get the line, look at whether the line is above the current price or below it in order to determine the support and resistance level.
Do keep an eye out for our posts by subscribing to our channel and social media.
None of the material above or on our website is to be construed as a solicitation, recommendation or offer to buy or sell any security, financial product or instrument. Investors should carefully consider if the security and/or product is suitable for them in view of their entire investment portfolio. All investing involves risks, including the possible loss of money invested, and past performance does not guarantee future performance.