AXEHEDGE

Financial Ratio: Operating Ratios (Part 2)

Total Asset Turnover, Inventory Turnover and Inventory Number of Days explained.

Before this, we have spoken about the Profitability Ratio category, which is a part of the whole financial ratio analysis. We have also touched some ratios under the Operating Ratios, particularly the Fixed Asset Turnover Ratio and Working Capital Turnover Ratio.

Here’s a little bit of catching up — when considering investments or trades, there are generally two approaches used by people to analyze their prospects. These approaches are known as technical analysis and fundamental analysis.

Each approach utilizes different methods to evaluate the worthiness of companies for investment. In this case, we will focus on the fundamental investors, also known as value investors, and their way of evaluating investments.

In a nutshell, fundamental investors seek to identify the intrinsic value of a company. They do this by examining the financial statements of the company, including the Profit & Loss Statement, Balance Sheet, and Cash Flow Statement. For a comprehensive guide on how to read these statements, you can click on the hyperlinks provided.

How do they examine all the financial statements above? By using financial ratios! If you want a general overview of how financial ratios work, check out this article — Fundamental: Introduction to Financial Ratios.

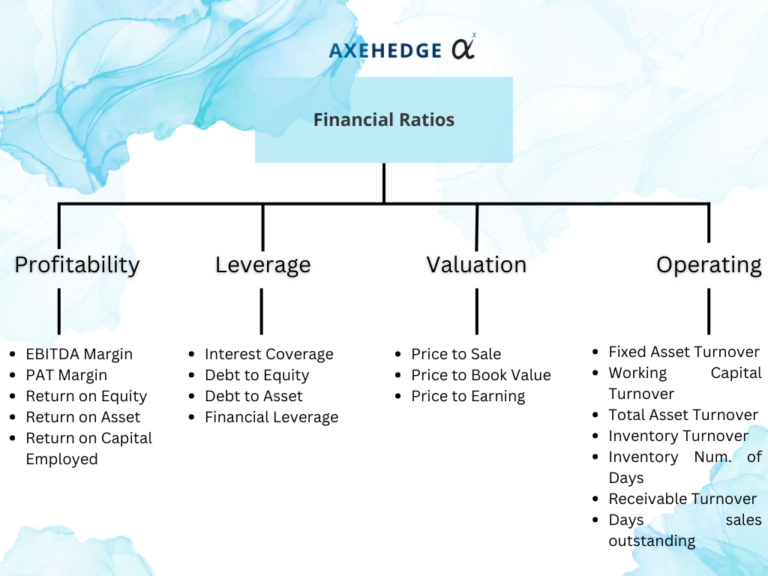
Please also look at the chart below to get a full picture of where we are:

So, we are in the “Operating Ratio” category while the types of ratios that we are going to discuss for now are the Total Asset Turnover, Inventory Turnover and Inventory Number of Days.

Quick note

For capital-intensive companies, it may be more appropriate to use financial ratios that are specifically designed to evaluate their performance, such as the return on invested capital (ROIC) or the asset turnover ratio. The ROIC measures the return that a company generates on the capital it has invested in its operations, while the asset turnover ratio measures how efficiently a company is using its assets to generate revenue.

Now, for this article, we will take Apple as our example (despite Apple being capital-intensive) because we think Apple’s annual report is well-structured and easy to use for beginners, but IRL, the operating ratio is more suitable for companies that are not capital intensive such as banks, etc.

Total Asset Turnover

The total asset turnover ratio is a financial ratio that measures how efficiently a company uses its assets to generate revenue. Specifically, it tells you how many dollars of revenue a company generates for each dollar of assets it owns.

A higher total asset turnover ratio generally indicates that a company is using its assets more efficiently to generate revenue. However, a very high ratio may indicate that the company is not investing enough in its assets to support future growth.

Overall, the total asset turnover ratio can be a useful indicator of a company’s operational efficiency and financial health, but it should be analyzed in conjunction with other financial ratios and factors before making any investment or business decisions.


How to calculate Total Asset Turnover?


The formula is as follows:

Total Asset Turnover = Operating Revenue / Average Total Assets

Where:

Average Total Asset = [Total Asset in Year 1 + Total Asset in Year 2] / 2

How to find all those things?

We’ll have a look at Apple’s Annual Report which you can download here.

First, you can have a look at its Statements of Operations to get its total revenue, and mind you revenue here refers to the money that they made from their operations, be it selling iPhones, iPads, Apple Music service, or whatever — and it refers to the money untainted by taxes, etc. It’s fresh from the customers’ wallets.

From here, you can see that Apple’s operating revenue is $394,328 million.

Next, we’ll look for its average total assets. First, we found that the total assets for FY2022 and FY2021 are $352,755 million and $351,002 million respectively. We will then calculate the average from these two.

Average Total Asset = [Total Asset in Year 1 + Total Asset in Year 2] / 2

Average Total Asset = [352,755 + 351,002] / 2

Average Total Asset = 351,878.5

So, the Total Asset Turnover for Apple’s FY2022 (until September) is:

Total Asset Turnover = Operating Revenue / Average Total Assets

Total Asset Turnover = 394,328 / 351,878.5

Total Asset Turnover = 1.12

Inventory Turnover

The Inventory Turnover ratio is a financial ratio that measures how efficiently a company is managing its inventory. Specifically, it tells you how many times a company’s inventory is sold and replaced over a period of time, such as a year.

A higher Inventory Turnover ratio generally indicates that a company is selling its inventory more quickly, which can be a positive sign. However, a very high ratio may indicate that the company is running out of inventory and may not be able to meet customer demand. On the other hand, a low ratio may indicate that the company is holding too much inventory and may have obsolete or unsold items.

Overall, the Inventory Turnover ratio can be a useful indicator of a company’s operational efficiency and financial health, particularly in industries where inventory management is critical. However, it should be analyzed in conjunction with other financial ratios and factors before making any investment or business decisions.


How to calculate Inventory Turnover?


The formula is as follows:

Inventory Turnover = Cost of Goods Sold / Average Inventory

Where:

Average Inventory = [Total Inventory in Year 1 + Total Inventory in Year 2] / 2

First, you will need to get its Cost of Goods Sold, which is mentioned in Apple’s Statement of Operations (but it’s not named exactly similar). Apple’s cost of sales (how much they spend to sell their products and services) is $223,546 million.

Now it’s time to get its average inventories, whereby you can find Apple’s inventory for FY2022 and FY2021 are $4,946 million and $6,580 million respectively. We will then calculate the average from these two.

Average Inventory = [Total Inventory in Year 1 + Total Inventory in Year 2] / 2

Average Inventory = [4,946 + 6,580] / 2

Average Inventory = 5,763

So, the Inventory Turnover for Apple’s FY2022 (until September) is:

Inventory Turnover = Cost of Goods Sold / Average Inventory

Inventory Turnover = 223,546 / 5,763

Inventory Turnover = 38.79

Inventory Num. of Days

The Inventory Number of Days ratio, also known as Days Inventory Outstanding, is a financial ratio that measures the average number of days it takes for a company to sell its inventory. It tells you how long a company holds onto its inventory before it is sold.

A lower Inventory Number of Days ratio generally indicates that a company is selling its inventory more quickly, which can be a positive sign. However, a very low ratio may indicate that the company is running out of inventory and may not be able to meet customer demand. On the other hand, a high ratio may indicate that the company is holding too much inventory and may have obsolete or unsold items.

Overall, the Inventory Number of Days ratio can be a useful indicator of a company’s operational efficiency and financial health, particularly in industries where inventory management is critical. It can help companies to identify potential issues with their inventory management and make necessary adjustments to improve their operations. However, like other financial ratios, it should be analyzed in conjunction with other financial metrics and factors before making any investment or business decisions.


How to calculate Inventory Number of Days?


The formula is as follows:

Inventory Number of Days = 365 / Inventory Turnover

This has become super easy because we have already calculated the Inventory Turnover above. So, let’s save everyone’s time and get to it.

Inventory Number of Days = 365 / 38.79

Inventory Number of Days = 365 / 38.79

Inventory Number of Days = 9.41

Bottom line

  • Total Asset Turnover ratio is a financial ratio that measures how efficiently a company uses its assets to generate revenue.
  • The Total Asset Turnover ratio is expressed in terms of a decimal or a whole number, not measured in percentage.
  • The Inventory Turnover ratio is a financial ratio that tells you how many times a company’s inventory is sold and replaced over a period of time.
  • The Inventory Turnover ratio is also expressed in terms of a decimal or a whole number.
  • The Inventory Number of Days ratio measures the average number of days it takes for a company to sell its inventory.
  • The Inventory Number of Days ratio is also expressed in terms of a decimal or a whole number.
  • All of these ratios should be analyzed in conjunction with other financial metrics and factors before making any investment or business decisions.
  • Some of the terms in the financial statements are reflected differently by companies, but if you understand what the numbers essentially represent, you’ll know which is which.

Do keep an eye out for our posts by subscribing to our channel and social media.

None of the material above or on our website is to be construed as a solicitation, recommendation or offer to buy or sell any security, financial product or instrument. Investors should carefully consider if the security and/or product is suitable for them in view of their entire investment portfolio. All investing involves risks, including the possible loss of money invested, and past performance does not guarantee future performance.

Written By

Become a AXEHEDGE investor today.