
Stock Chart Trading: Understanding Volumes
How volume tells you when and when not to place a trade.

Before this, we have spoken about candlestick patterns, i.e., how can a certain candlestick shape tell you when is best to place your trade, and when is best to sell? Now, we will look into another indicator that can tell you — or at least affirm to you whether it is indeed the best time to buy or sell — volume!
What does volume stand for?
In finance, particularly in investment or trade, volume is the number of shares bought and sold over a certain period (usually daily). Let’s look at an example to make it easier for us both. Here’s Apple’s price chart. The price chart is the one at the top, the one that is moving up in sort of a stairs-looking way, meanwhile, the volume graph is the one at the bottom (the one where I circled one of the bars).

As you can probably see, on the right-hand side of the graph, there is a blue indicator that states “Volume 57.95M,” now what that means is that on the latest date (which is most likely May 17th, 2023) the volume is at 57.95 million.
Ok, but what does it stand for? Volume stands for how many times the asset (in this case it’s stock) is completely traded in that particular period (in this case it’s daily). Let’s make it simple — when you sell 1 unit of Apple stock, and someone else buys it, it’s considered as 1 volume.
See the one I circled? It shows that on that particular day, the volume was exceptionally high, which means people are taking an interest in Apple’s shares. What happened exactly before that is Apple released their earnings data, which impressed investors. So, people are rallying with Apple’s stock on that day.
If you put your stock for sale but no one buys it, will it be counted? The answer is no. Is volume counted when you sell it, or when people buy it? The answer is, it’s when the transaction is completed, i.e., when people actually buy what you have put up for sale.
Simple, isn’t it? The volume stands for how many units of an asset have been sold and bought in a day.
What do volume trends tell you?

Let’s take a moment to appreciate how fly is that drip.
Anyhow, back to where we were, why is volume important when you trade? Why should you look into volumes when you want to place your trade? First, let’s burn this into our minds — how (obviously) institutional traders are trading in a sum that is way above how retail traders do. People like you and me, even if you’re born rich, perhaps can only go up to $1 million and that’s it, but when we speak of institutional traders, these are the big companies — big financial institutions, who will have “million” as a normal value in their trades.
Okay… so what? So, when these big guns trade on a particular stock, you can see that the volume increases massively. If a company with 100 analysts bets on a stock, it might be a good decision for you to also look the same way, isn’t it? Let’s make it clear — if a stock’s volume suddenly spikes, it might show that a big company is either buying or selling it en masse. Either way, it shows concern over the company, be it in a good or a bad way.
Can it just be normal people like you and me moving in bulk…? The answer is yes — but isn’t that also a thing to be concerned about? A bunch of nobodies suddenly all crowding this one company, either to buy or to sell it — doesn’t it scream “Lookie here, some things are going down here!”?
Now, let’s move a little more specifically on how you can read market sentiment by looking at the volume and price movement.
How to trade by looking at volume?

As discussed, volume and price movements tell you a lot about the emotions and sentiments surrounding the market. Here are a few instances that will usually play out:
1. Price Increase while Volume Increase
This is what people who are looking to buy will look for. When the price increases as volume increases, it’s like that one toy store that closes super late before Christmas — with workaholic dads crowding it — you know that the crowds are willing to throw their cash away and do whatever it takes to buy. This is usually a sign of a bullish price movement, many people are dealing, and the price is up, which means in that big crowd, people are willing to pay higher prices to buy.
All in all, it’s usually a good time to buy.
2. Price Increase while Volume Decline
When the price increases but the volume somewhat declines, it’s a show of caution, i.e., you shouldn’t bet your life on it — be extra cautious. It might look like the price is going up, but it is in no way a true indication that the market at large is actually interested in the stock.
In a better analogy, if you’re waiting for rain, a situation where price increases along with volume are almost like when you can see the dark cloud and hear thunders start rumbling — it’s almost certain that rain is coming — but in a situation where price increases but the volume declines, it’s like when you just start feeling the wind, maybe rain is coming, but also maybe not, only time can tell.
In short, it might not be a safe bet for you to buy, as you can’t be certain ton what is actually going on.
3. Price Decline while Volume Increase
In opposition to the first situation, this is an indication that the selling sentiment is strong. So you see the crowd is gathering in this one company’s booth and the next thing you know the price is crumbling down. What does it mean? It means that people are selling it en masse, and people are willing to sell it at lower prices, even, such a not-so-good sentiment for the company price.
What should you do, then? This is usually the best time to sell or to short-sell.
4. Price Decline while Volume Decline
This is also a situation where the market sentiment is uncertain. There’s not enough crowd to point in a certain direction. So, what you should do is don’t start selling or short-selling yet but keep yourself cautious about the price development.
How your thought process should be
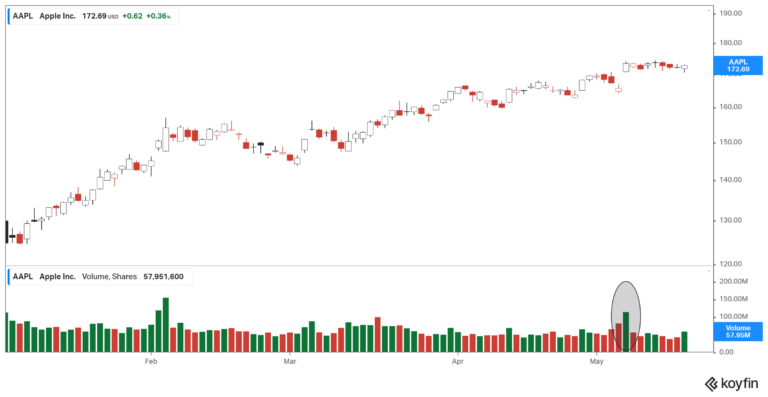
As of now, we have learned about candlestick patterns, we have learned about support and resistance, and we have also learned about volume. Here’s an example of a situation in which you can make an informed decision while trading:
First, you see that a Bullish Harami pattern is forming, which usually means that the downtrend is going to move into an uptrend. Now, look at whether the chart is moving close to its support level. If the answer is yes, then you can almost press the “buy” button. Now, one last inspection, is everyone else on the same page as you? The volume increases! It means people are getting interested. Time to buy!
Bottom line
- Volume represents the number of assets being sold in one particular period.
- 1 unit of volume represents an asset that is successfully sold by A, which is also bought by B.
- Volume can tell you if a trend is actually happening or not.
- High volume usually means institutional traders are involved.
- Look to buy when volume and price increase.
- Look to sell when volume increases but price declines.
- In a situation where price moves but volume is low, you might want to be careful.
Do keep an eye out for our posts by subscribing to our channel and social media.
None of the material above or on our website is to be construed as a solicitation, recommendation or offer to buy or sell any security, financial product or instrument. Investors should carefully consider if the security and/or product is suitable for them in view of their entire investment portfolio. All investing involves risks, including the possible loss of money invested, and past performance does not guarantee future performance.