How to trade when you see the Bullish Harami pattern?
Back again with our 2-days candlestick pattern, which is simply how you can peek into the market sentiment by looking at how the candlestick forms.
Harami is Japanese for “pregnant”, in which the candlestick pattern does somewhat looks like it’s pregnant. It is a bullish pattern which means that it indicates that the price trend might move upwards.
Now, before we start, we’ll make it clear that these patterns are identified throughout the many repetitive occurrences — for example, this one right here is a bullish pattern, which tells you that the price might move up, so there are many instances where price moves up after this pattern forms. Is it guaranteed? Sadly, no. In fact, there is no guaranteed way of identifying when exactly the price is going to go up or down.
Then how do traders make money? They can’t guarantee anything as much as you and I, what traders do is that they try to make the best guess possible by maximizing their chances of success. How to maximize your chance of success? By trying to look at other indicators apart from just looking at one single pattern to place your buy and sell.
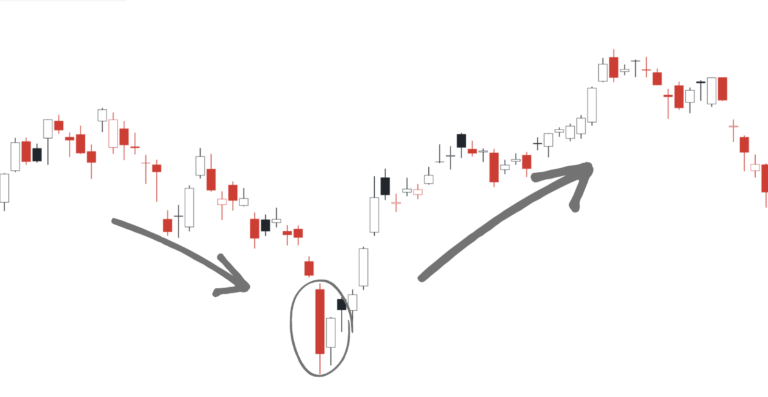
If you see this pattern appearing just as the trend touches the support line, then you might have another indicator that supports the guess of the price going up. What is a support line? Read it here. If you have more indicators supporting the same sentiment, the higher the likeliness will be.
Characteristics of The Bullish Harami Candlestick
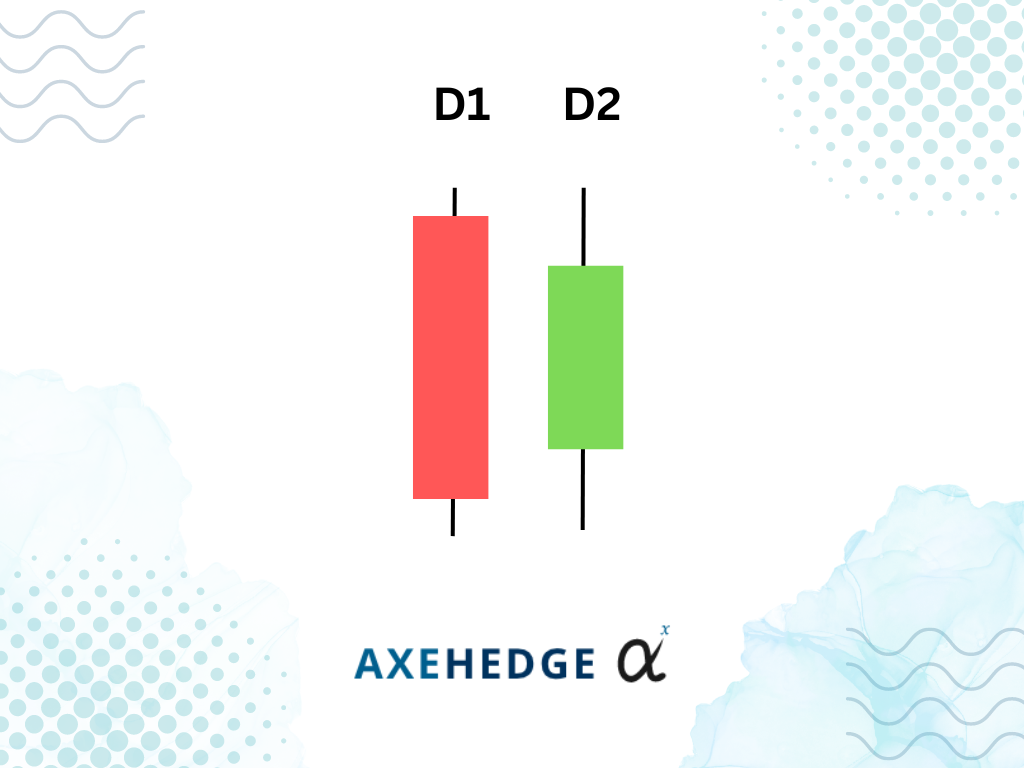
Here’s how you can identify a bullish harami:
It appears in a downtrend.
The first day’s candlestick (D1) is a red candlestick.
D1 candlestick sets a new low in the downtrend.
The second day’s candlestick (D2) opens higher than D1’s closing price (the lower body of the red candlestick).
The second day’s candlestick close is lower than D1’s opening price, but higher than D2’s opening price, making it a green candlestick (open low close high = green, open high close low = red).
In terms of appearance, the body of D1’s red candlestick sort of overshadows D2’s green candle.
How big or how small the green candle is doesn’t really matter, as long as it sticks in between the red candle (but make sure it’s not too small, size doesn’t matter, but you shouldn’t require a microscope to see it, lol).
What does the Bullish Harami candlestick tell you?
The market is in a downtrend. The sentiment is bearish, people are selling hard.
D1 opens lower than the day before and somewhat ends up even lower (red candle). Boy, the selling drive sure is strong!
D2 opens at a higher point! What’s happening? People are starting to buy it now. Is the price too low that people think it’s a good time to buy?
D2 closes in green — people are buying, which drives the price higher. The bullish sentiment may kick in.
Essentially, it tells you that there might be a chance that the sentiment may have changed, and people are buying more and more, which drives the price up.
How to trade?
There are generally two ways in which you can approach a trade, by playing it risky or by being risk averse.
Risky:
If you’re a risk-taker, what you can do is buy at D2’s closing price (when the market nears closing time). However, be sure to observe these two conditions — first, the price nearing the close of D2 is higher than D1’s open; and second, D2 opens lower or the same as D1’s closing price.
You can put your stop loss at whichever point is the lowest point that the price moved to within the two days (not open or close price). Say, if the bottom tail in D1 is the lowest point at $100, then you put your stop loss at $100.
Risk Averse:
If you’re a risk-averse trader, then you might want to wait until it’s near the closing time of the next day to see if the price on the third day is in fact bullish. If it is, then you might want to buy it before the market closes.
Just like when going risky, you can put your stop loss at whichever point is the lowest point that the price moved to within the two days (not open or close price). Say, if the bottom tail in D1 is the lowest point at $100, then you put your stop loss at $100.
However, given that you’re buying on the third day, you might want to be prepared to buy at a price higher compared to if you bought on the second day (D2).
Bottom line
The bullish harami appears in a downtrend, where sentiment was bearish, but it indicates that the price may move up (bearish sentiment may kick in).
The appearance is a D1 red candle which sets a new low in the downtrend followed by a D2 green candle which is not lower nor higher than the red candle (look at the image to get how it looks like).
The bullish harami tells you that there might be a chance that the sentiment may shift to an uptrend.
A risky trader place their trade on D2, while a risk averse trader would wait until the third day and see if the third day’s candle is in fact a green one.
Use other indicators and analysis as well to get a proper overview of what’s going on — it will help you make more informed decisions.
Do keep an eye out for our posts by subscribing to our channel and social media.
None of the material above or on our website is to be construed as a solicitation, recommendation or offer to buy or sell any security, financial product or instrument. Investors should carefully consider if the security and/or product is suitable for them in view of their entire investment portfolio. All investing involves risks, including the possible loss of money invested, and past performance does not guarantee future performance.