How to trade when you see the inverted hammer pattern.
The inverted hammer candlestick is a familiar pattern to many. It looks almost like the shooting star pattern or an upside-down version of the hammer candlestick (as the name suggests). Also, just like the shooting star or hammer pattern, the inverted hammer is bullish, indicating that the price may be shifting from a downtrend to an uptrend.
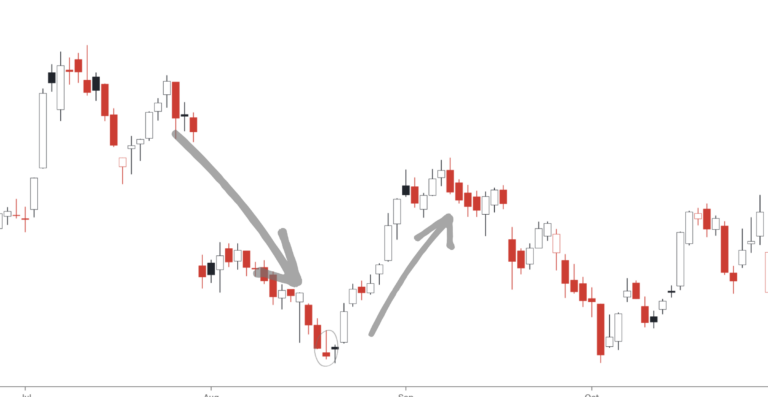
The picture above may not properly represent how an inverted hammer looks like, so we’ll have a look at the image below, yes?
Now, before we start, we’ll make it clear that these patterns are identified throughout the many repetitive occurrences — for example, this one right here is a bullish pattern, which tells you that the price might move up, so there are many instances where price moves up after this pattern forms. Is it guaranteed? Sadly, no. In fact, there is no guaranteed way of identifying when exactly the price is going to go up or down.
Then how do traders make money? They can’t guarantee anything as much as you and I, what traders do is that they try to make the best guess possible by maximizing their chances of success. How to maximize your chance of success? By trying to look at other indicators apart from just looking at one single pattern to place your buy and sell.
If you see this pattern appearing just as the trend touches the support line, you might have another indicator supporting the guess of the price going up. What is a support line? Read it here. The higher the likeliness will be if you have more indicators supporting the same sentiment.
Characteristics of The Inverted Hammer
Here’s how you can tell if it’s an inverted hammer:
· Appears in a downtrend.
· The price opens a new low in the downtrend (when the hammer appears.
· The shape is like an upside-down Thor’s hammer, with its handle (upper tail) measuring more than twice the hammer’s head (the candle body).
· There is none or at most a negligible lower tail below the candle’s body.
· Whether the body is green or red doesn’t matter, but green is better.
What does the inverted hammer tell you?
· It appears in a downtrend, so at that point the selling sentiment is strong, people keep on selling until the price falls (bearish market).
· On the day which the inverted hammer appears, the price opens at a new low — which indicates that the market started off still with the same selling sentiment.
· During the day, however, the price moves up very high (which explains the long upper tail), despite settling lower than the movement price. This shows that buying sentiment may kick in, which is why the price roamed high.
· Simply, it’s like you’re hearing a knock at the door, and that could as well be the bullish market.
· At this point, it depends on the market whether they’re going to ‘panic’ buy which would drive the price up, or if the sell sentiment is just too strong, then the price will just move as it was.
How to trade?
There are generally two ways in which you can approach a trade, by playing it risky or by being risk averse.
Risky:
· If you’re a risk-taker, what you can do is buy on the same day when the pattern appears. Just make sure that the pattern is likely to appear (buy it when the market is near closing time).
Risk Averse:
· If you’re a risk-averse trader, then you might want to wait until it’s near the closing time of the next day to see if the price on the second day is in fact bullish. If it is, then you might want to buy it before the market closes.
· However, given that you’re buying on the second day, you might want to be prepared to buy at a price higher compared to if you bought on the first day.
Bottom line
The inverted hammer appears in a downtrend, where sentiment was bearish, but it indicates that the price may move up (bullish sentiment may kick in).
It is identified by a long upper tail and a short body at the bottom.
It indicates that there might be a chance for a bullish market to kick in.
You can play it risky and buy it on the same day, or you can play it safe and buy it the day after when you can confirm the 2nd-day candle is green.
Try looking for other indicators to support the sentiment in order to maximize your chance for success.
Do keep an eye out for our posts by subscribing to our channel and social media.
None of the material above or on our website is to be construed as a solicitation, recommendation or offer to buy or sell any security, financial product or instrument. Investors should carefully consider if the security and/or product is suitable for them in view of their entire investment portfolio. All investing involves risks, including the possible loss of money invested, and past performance does not guarantee future performance.