AXEHEDGE

Stock Chart Trading: Introduction to Support and Resistance

What are support and resistance when trading?

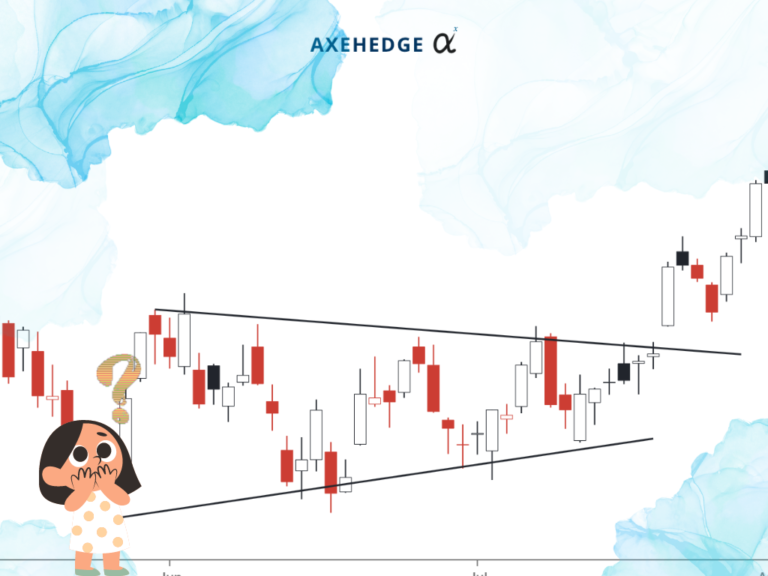
In many of our articles, we did mention support and resistance when looking at an asset chart. There are many uses to knowing about support and resistance when you are trading, it can tell you the sentiment of the market when you can place your buy, when is the best time to sell, where to put your stoploss, and more.

In this article, we will explain to you in general what are support and resistance, without going into the details of how to look for the support or resistance level, as well as how to exactly measure when to place your buys or sells. We will explain all that in separate articles. For this article, the key objective is to just get a general overview of the concept of support and resistance.

What are support and resistance?

Support


The level of support is a particular price level at which the price is having a hard time breaking below that price level. At this price level, the number of buys is commonly more than the number of sells, which is why it is hard for the price to go below that level, since when it reaches that point, people would think that is the best time to buy. So, every time the price falls to that point, people will gather for a good bargain.

The easiest way to identify a support level is that it usually sits below the current market price of the asset.


Resistance


The resistance level is a point where it is hard for the price to move beyond it. At this price level, the force of sells outnumbers the buys, which then drives the price down whenever it reaches that point. That is why it’s hard for the price to move beyond the resistance level because whenever it reaches that point, people will want to sell their asset at a point in which they think the price won’t go up any further thus maximizing their profit.

The easiest way to identify a resistance level is that it usually sits above the current market price of the asset.

What do support and resistance tell you?

Support


  • Prices tend to bounce back up after reaching that level.
  • It represents a potential buying opportunity.
  • Traders may enter into long positions.
  • Investors may look to add to their existing positions.
  • If the price bounces back, it indicates that the support level is strong, if often breached, then the support level is weak (you might want to find a new level).
  • Alternatively, if the support level is breached at a rapid and remarkable rate, it could indicate a changing sentiment toward a bearish market.


Resistance


  • The stock has selling pressure when it reaches that point.
  • Stock prices tend to stop rising or even move downwards after reaching that level.
  • It represents a potential selling opportunity.
  • Traders may exit long positions.
  • Investors may look to take profits from their existing positions.
  • If the price fails to move beyond resistance, it shows weak demand for the asset at that price.
  • Alternatively, if the price moves beyond the resistance level, it indicates a strong sentiment to buy, which could indicate a bullish movement.

What to do when I see them?

What to do when you identify a support level in the price movements?


  • Consider buying the stock: If the stock price is approaching the support level, you may consider buying the stock at that price or slightly above it, as it represents a potential buying opportunity.
  • Set a stop-loss order: A stop-loss order is an order to sell the stock if it falls below a certain price level. By setting a stop-loss order just below the support level, you can limit your potential losses if the stock price continues to decline.
  • Monitor the stock price: Even if the stock price bounces back up from the support level, it is important to continue monitoring the stock price and market conditions, as the stock price may still be volatile and subject to further fluctuations.
  • Consider other technical indicators: While the support level can be a useful technical indicator, it is important to consider other technical indicators such as moving averages, volume, and chart patterns to confirm your analysis and make more informed trading decisions.


What to do when you identify a resistance level in the price movements?


  • Consider selling the stock: If the stock price is approaching the resistance level, you may want to consider selling the stock at that price or slightly below it, as it represents a potential selling opportunity.
  • Set a take-profit order: A take-profit order is an order to sell the stock once it reaches a certain price level. By setting a take-profit order just below the resistance level, you can lock in your profits if the stock price continues to rise.
  • Monitor the stock price: Even if the stock price fails to break through the resistance level, it is important to continue monitoring the stock price and market conditions, as the stock price may still be volatile and subject to further fluctuations.
  • Consider other technical indicators: While the resistance level can be a useful technical indicator, it is important to consider other technical indicators such as moving averages, volume, and chart patterns to confirm your analysis and make more informed trading decisions.

Bottom line

  • Support is a price level at which a stock has historically found support, meaning the stock’s price has tended to bounce back up after reaching that level.
  • Resistance is a price level at which a stock has historically encountered selling pressure, meaning the stock’s price has tended to stop rising or even decline after reaching that level.
  • Support and resistance levels can be identified by analyzing a stock’s price chart over time.
  • Support and resistance levels are not placed at a definite value. You should consider it as a ‘danger zone’ and not a ‘danger line’. The reaction can be triggered either before or after it reaches the price level of support or resistance.
  • Support and resistance levels can provide useful information for traders and investors, as they represent potential buying or selling opportunities, and can also be used to set stop-loss and take-profit orders.
  • However, it is important to conduct thorough research and analysis before making any investment decisions and to consider other factors such as the company’s financial health, industry trends, and overall market conditions.

Do keep an eye out for our posts by subscribing to our channel and social media.

None of the material above or on our website is to be construed as a solicitation, recommendation or offer to buy or sell any security, financial product or instrument. Investors should carefully consider if the security and/or product is suitable for them in view of their entire investment portfolio. All investing involves risks, including the possible loss of money invested, and past performance does not guarantee future performance.

Written By

Become a AXEHEDGE investor today.