How Moving Average can help you decide on trades (and investments too)?
Hi there! Welcome to another chapter of our series on technical analysis. If you’re not yet in the know, here’s the general overview.
In finance, there are two main paths to follow (much like joining the force and the dark side) — either you trade or invest (if you don’t know the difference between the two, listen to our podcast here) — and traders would usually use technical analysis to identify what and when to buy (or sell), meanwhile, investors would use fundamental analysis.
So, under technical analysis, we’ve spoken about how to identify stock chart patterns, we’ve looked into how volumes can help you make a better decision, and now we are at the moving average.
What is the Moving Average?
The moving average is a lagging indicator, which means that it’s only able to identify a trend after it has happened. Is that bad? No, not really. It just means that the train is departing, and you might still have the time to jump onboard (or off).
It calculates the average movements of price in a set period — for example, a 10-day moving average tells you how much the price has moved from day 1 until day 10 — on the 10th day. Confusing, isn’t it? We’ll make it simple.
First and foremost, what kind of price are they measuring? Is it the day’s high? The day’s low? The day’s closing price? The answer is — up to you, because some choose to look at highs and some lows, but usually people would look at the closing price, as it is the price where the market settles at.
The second-most-important thing is that there are two kinds of moving averages: simple moving averages and exponential moving averages. What are these two? Let’s have a look!
Simple Moving Average (SMA)
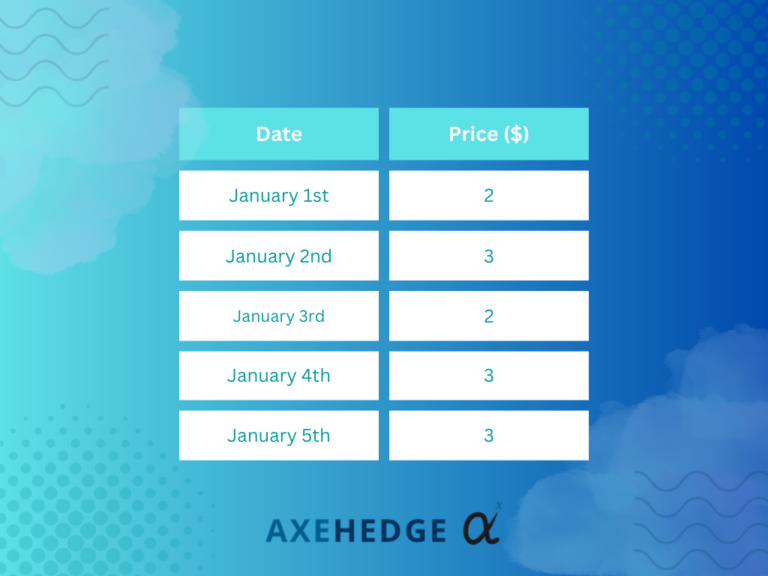
For this explanation, we will use the closing price, alright? So, imagine if someone says, “Look at the 5-day moving average of Company ABC on January 5th,” how it’s calculated is — let’s say here’s the closing price for Company ABC from January 1st to January 5th:
You know how to calculate average right? But here’s a simple way to calculate it.
Average price = sum of price in x number of days / x number of days
In this context:
Average price = (2+3+2+3+3) / 5
Average price = 2.6
So, you can say the price (closing price) 5-day moving average on January 5th is $2.6.
Let’s say the price closes on January 6th at $2. How do you calculate its 5-day moving average? Easy, from January 6th, look back five days, i.e., from January 2nd to January 6th. So, the moving average would be:
Average price = (3+2+3+3+2) / 5
Average price = 2.6
Well… it’s still $2.6 because we lack creativity with the price movement, but the real-world ones wouldn’t be so peaceful.
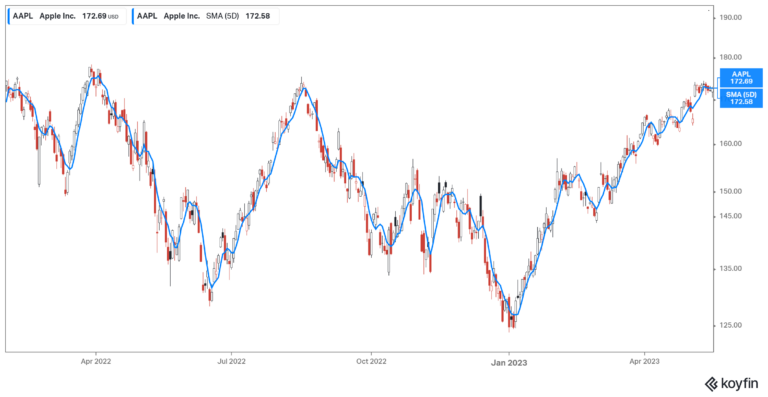
Here’s Apple’s 5-day SMA that we found using charting software (which you can also find online — note, we are not commissioned for this).
See the blue line? That is the 5-day moving average. See on the top-left corner there are two prices? One of them is the latest closing price, while another is the latest 5-day SMA. The line may look not too different from the price chart itself because we use 5-day. If we widen the gap (like, use 100-day or so) maybe we can see the difference.
Question: how many days are usually used?
Honestly, that would depend on your strategy, but investors and traders would usually look at a 50-day moving average and a 200-day moving average. Traders would usually use shorter moving averages because they would go for short-term buy and sell, meanwhile, investors would go for longer ones.
Exponential Moving Average (EMA)
Now, moving on to the exponential moving average, in which, we won’t be doing the calculation for this one, because you can just use a free charting software online to get it — and the calculation process is a bit lengthier (and unnecessary for you to look into) — just know this:
When you use SMA, the final price will be equally affected by the price for each date, the $2.6 above is affected by all the $2 and $3 from January 1st to January 5th, right? In finance, however, the price points may not hold equal weight from one another.
Why? Because, say, the older the date, the less relevant the price is to what’s happening right now. If you want to know the sentiment now, what happened 500 days back won’t be too relevant now, would it? So, what EMA does is essentially assigns a certain weightage to the price based on the relevance.
For example, say — the latest price will affect the EMA more than an old price, all in all, what it does is EMA gives you the average price movements based on the most relevant data to the current sentiment.
The above is Apple’s EMA. As you can see on the price at the top-left-side, the price is a bit different — like a very teensy-weensy bit of difference, but you can see more difference if we use a wider gap, like 100 days moving average or so.
Question: which one is used more?
If you’re a trader who seeks to go for short-term buying and selling, the EMA would be of more use to you, and traders usually prefer EMA over SMA, because EMA gives more weightage to the most recent data compared to SMA, thus, its indicator is quicker to react to the latest sentiment.
How to apply moving averages in your trade?
There are generally two ways that you can take, the simpler one, and a simple-but-with-extra-steps one called the Moving Average Crossover. Before anything, keep this in mind — the moving average is important as it tells you if the current price is above, below, or similar to its average price — if it’s above the average, it means that the buying sentiment is good, and vice versa.
Simple
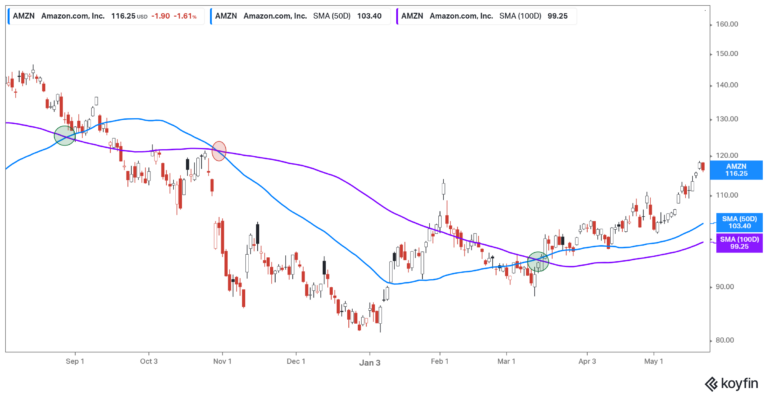
The rule when going simple is — well, simple. You buy when the current price is above the moving average line and sell when the price is below the moving average line. Let’s take a look at this example where we use Amazon’s chart paired with a 50-day SMA line (the blue line).
From the image above, we have marked in green circles where you’ll buy, and where you’ll sell is marked in red circles. See how if you follow this strategy, you can make a huge profit from the end of July to September and avoid massive losses when you sell in October.
If you look closely, somewhere around September 1st and March 1st, there are a few instances where you’d buy and sell in a short span of time — and mind you — Amazon’s stock is still (relatively) stable in terms of its price movements. Imagine if the stock is more volatile, you’d be buying and selling like nuts if you use this method.
Now, that’s the downside of this method. If the graph is moving sideways, it’s easy for the price to move below or above the moving average in a short span of time. So, if you have to buy and sell every time the current price moves above or below the average line, each transaction may cost you fees, and this will actually eat up your profit (or even make you suffer loss). The best-case scenario in this scene is that you’ll get profits that are barely enough.
How do people overcome the issue? By using the moving average crossover method below!
Moving Average Crossover
How it works is that the crossover method uses two moving average lines of different time ranges in one chart, and these two lines will tell you when to buy and sell.
So, how it works is that there will be a shorter-period line and a longer-period line, so if the shorter-period line is above the longer-period one, you buy. If the shorter period goes below the longer period, you sell. Pretty easy right? Let’s take a look at how it works in real life from the same example as above. Right now, we will use the 50-day and 100-day moving average.
See how from the method above, you’ll only buy twice and sell once throughout the same time frame? That’s what this method generally does — it ‘smoothens’ the chart a bit so that you can identify only a few points for buy and sell.
General note:
As you can also see, if you buy at the first green circle and sell at the first red, you’ll actually end up at a loss — a slight loss. Now, here’s the thing about using the moving average strategy — be it the simple or crossover method, you might eventually buy higher and sell less, but your losses would usually be marginally smaller compared to the gains.
Look at how much gain you get when you buy at the second green circle (21.5% — so far). So, here’s a general idea that usually happens (not guaranteed to happen) — when you don’t ignore any buy or sell signals when using the moving average strategy, you would likely make big gains with smaller losses — i.e., your portfolio would gain moderately (because your big gains will have some of its cuts for the little losses).
Also, it would help if you identified other indicators as well, such as if there’s any pattern forming when it’s near buying or selling points, or if the graph is moving towards its support or resistance line.
What are the usual ‘combos’ used?
For the crossover system, here are the most commonly used pairs:
Intraday: 15 minutes & 30 minutes.
Short-term (a few trade sessions): 10-day & 20-day.
Medium-term (a few weeks): 25-day & 50-day.
Medium-term (a few months): 50-day & 100-day.
Long-term (investment, a year or more): 100-day & 200-day.
Bottom line
There are generally two kinds of moving averages, the Simple Moving Average (SMA) and the Exponential Moving Average (EMA).
The EMA is more commonly used as it prioritizes the latest data points, hence providing more insights into the latest trend.
There are two ways you can use moving averages to identify when to buy and when to sell — the simple way or using the moving average crossover method.
The moving average period depends on your strategy, whether you’re trading or investing.
All in all, you can use any free charting software available online to see the line without having to calculate it.
Do keep an eye out for our posts by subscribing to our channel and social media.
None of the material above or on our website is to be construed as a solicitation, recommendation or offer to buy or sell any security, financial product or instrument. Investors should carefully consider if the security and/or product is suitable for them in view of their entire investment portfolio. All investing involves risks, including the possible loss of money invested, and past performance does not guarantee future performance.