How to trade when you see a Bearish Harami pattern.
We have already discussed the Bullish Harami in our previous article, now it’s time to look into the bearish side of it. How can the exact same pattern tell two different things? We’ll find out in a while but before that, our usual disclaimer:
These patterns are identified throughout the many repetitive occurrences — for example, this one right here is a bearish pattern, which tells you that the price might move down, so there are many instances where the price moves down after this pattern forms. Is it guaranteed? Sadly, no. In fact, there is no guaranteed way of identifying when exactly the price is going to go up or down.
Then how do traders make money? They can’t guarantee anything as much as you and I, what traders do is that they try to make the best guess possible by maximizing their chances of success. How to maximize your chance of success? By trying to look at other indicators apart from just looking at one single pattern to place your buy and sell.
If you see this pattern appearing just as the trend touches the resistance line, you might have another indicator supporting the guess of the price going up. What is a resistance line? Read it here. The higher the likeliness will be if you have more indicators supporting the same sentiment.
Characteristics of The Bearish Harami
Here’s how you can identify a bearish harami:
It appears in an uptrend.
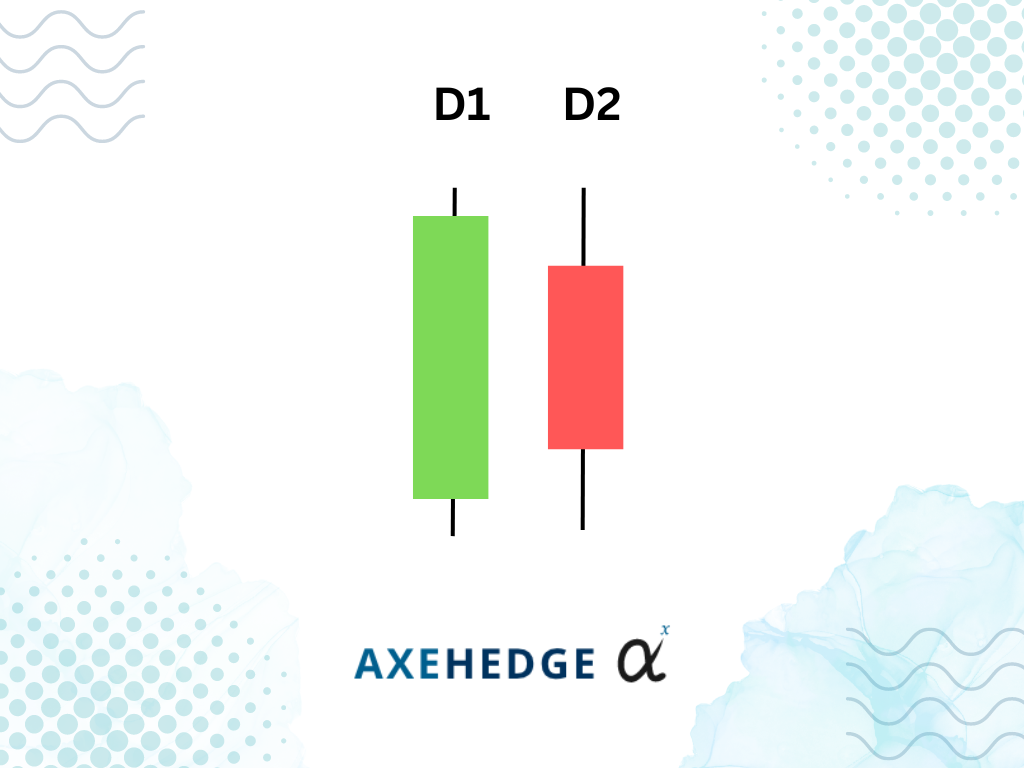
The first day’s candlestick (D1) is a green candlestick.
D1 candlestick sets a new high in the uptrend, and it finishes in green (open low, close high).
The second day’s candlestick (D2) is a red candlestick (open high, close low).
D2’s body is in between the body of D1, not more, not less.
In terms of appearance, the body of D1’s green candlestick appears to overshadow D2’s red candle.
How big or how small the red candle (D2) is don’t really matter, just make sure it’s not too tiny.
What does the Bearish Harami candlestick tell you?
Before we go any further, just a quick reminder that “Harami” stands for “pregnant” in Japanese, hence the picture above.
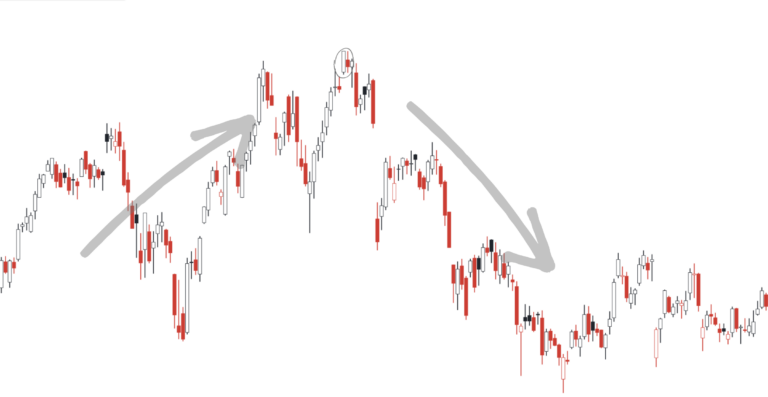
It appears in an uptrend, so the sentiment at that time was bullish, people keep on buying and buying, driving the price up.
The D1 candle sets a new high, which was thought of as a continuation of the trend that is ongoing.
However, D2’s price opens lower than D1’s closing price, and it somewhat finishes in red, despite not being lower than D1’s opening price — it shows that there is a chance the sentiment is waning off.
Right now, it signals to you and everyone else in the market that the price may not push any higher, and people may start selling — which may open the door for a bearish market (price falling).
Just to be clear, this only indicates a possibility that the sentiment is waning. Sometimes it doesn’t happen that way. Look for more indicators to support your trading decision.
How to trade?
There are generally two things that people would consider doing when they see the pattern appearing — short selling or selling whatever shares they have in the stock (also called “taking profit”). Two approaches are taken in doing these two things: playing it risky or being risk averse.
Risky
If you’re short selling, you can start your trade on the same day as when the pattern appears. Just make sure that D1’s candlestick is green and that it sets a new high when it closes, and D2’s open is lower than D1’s close, but D2’s price when the market near closing time (the U.S. market closes at 4 pm) is higher than D1’s open.
Short sellers’ stop loss can be put at whichever point is the highest price in D1 and D2.
If you’re taking profit, you can sell near the closing time of the next day when you can confirm that the candle is indeed red. (if the second day’s candle is red, traders would usually consider it as a confirmation that the pattern is forming and working).
Risk Averse
If you’re short selling, you can start trading near the market close the next day (3rd day) when you can confirm that the candle is forming a red.
Short sellers’ stop loss can be put at whichever point is the highest price in D1 and D2.
If you’re taking profit, you can sell your position at the market closing time on the day that the pattern forms. This way, you can avoid selling for less when the price really falls the next day.
Bottom line
The bearish harami candlestick indicates a change in the market sentiment from bullish to bearish.
The strong sell sentiment managed to drive the price down.
The pattern will often occur within two consecutive periods (usually days) in the market.
It’s identified by the first day which is a larger green candlestick at the top of an uptrend followed by a smaller red candlestick in between the D1’s candle body.
Slight variation in price is negligible but be sure that small really means small.
A risk-taking trader would short sell on D2, meanwhile, a risk-averse trader would short sell on D3.
Do keep an eye out for our posts by subscribing to our channel and social media.
None of the material above or on our website is to be construed as a solicitation, recommendation or offer to buy or sell any security, financial product or instrument. Investors should carefully consider if the security and/or product is suitable for them in view of their entire investment portfolio. All investing involves risks, including the possible loss of money invested, and past performance does not guarantee future performance.