AXEHEDGE

Stock Chart Trading: Bearish Engulfing Candlestick

How to trade when you see a Bearish Engulfing Candlestick.

In our previous article, we discussed the Bullish Engulfing Candlestick, which is a reversal pattern that indicates the shift of market sentiment from a bearish to a bullish sentiment. Now, we will look at its not-so-identical twin, the bearish engulfing candlestick!

The way that it looks is very much like the bullish pattern, but this engulfing candlestick pattern somewhat indicates the very opposite sentiment — that the market is shifting from bulls to bears. How so? Let’s find out!

Characteristics of The Bearish Engulfing Candlestick

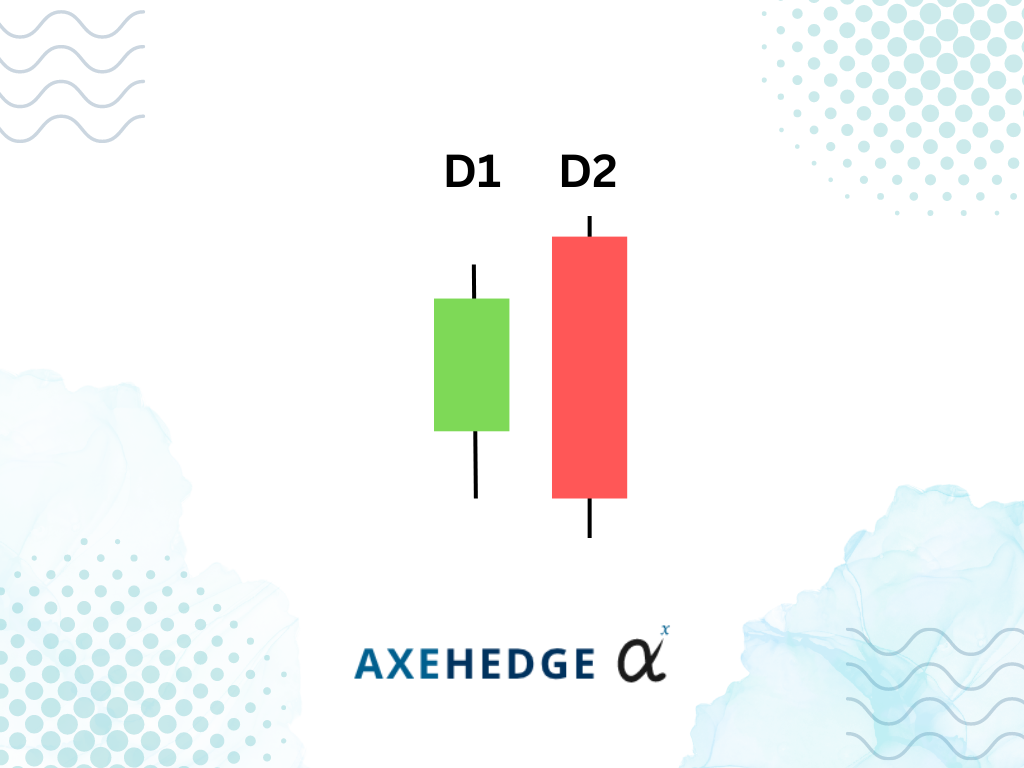
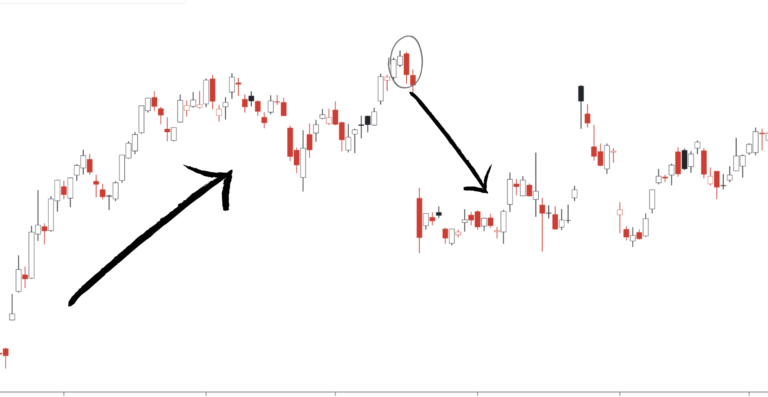
Here’s how to identify a bearish engulfing pattern:

  • It appears in an uptrend (a bullish market).
  • The first day’s candlestick (D1) is a green candlestick which sets a new high for the price during the trend.
  • It is followed by the second day’s candlestick (D2) which opens higher than D1’s closing price.
  • D2’s closing price however is much lower than D1’s opening price, making the body of the D2 candlestick appear as if it overshadows D1’s candlestick completely.
  • To put it simply, you can just look at the peak of an uptrend where the first candle is a small green one, followed by a red candlestick the very next day, in which the body of the red one is bigger than D1’s body from top to bottom — if you watch The Hobbit, it’s like Bilbo is standing next to Azog.

What does the bearish engulfing candle tell you?

  • It appears in an uptrend, so the current mood of the market, before it appears, was a good one. People are buying and buying, pushing the price up.
  • When D1 appeared, the buying sentiment was still strong as it pushed the price higher.
  • During the opening price of D2, it sets another new high for the trend, showing that the market tried to push the price even higher.
  • However, the mood in D2 wanes as people are starting to say “screw this,” and sell — they sell, and sell, causing the price to drop significantly, even lower than the opening price of D2.
  • That showed the mood may have changed for the market and that the bearish sentiment may kick in soon.

How to trade?

There are generally two things that people would consider doing when they see the pattern appearing — short selling or selling whatever shares they have in the stock (also called “taking profit”). Two approaches are taken in doing these two things: playing it risky or being risk averse.

Risky

  • If you’re short selling, you can start your trade on the same day as when the pattern appears. Just make sure that D1’s candlestick is green and that it sets a new high when it closes, and D2’s open is higher than D1’s close, but D2’s price when the market near closing time (the U.S. market closes at 4 pm) is lower than D1’s open.
  • Short sellers’ stoploss can be put at whichever point is the highest price in D1 and D2.
  • If you’re taking profit, you can sell near the closing time of the next day when you can confirm that the candle is indeed red. (if the second day’s candle is red, traders would usually consider it as a confirmation that the pattern is forming and working).

Risk Averse

  • If you’re short selling, you can start trading near market close the next day when you can confirm that the candle is red.
  • Short sellers’ stoploss can be put at whichever point is the highest price in D1 and D2.
  • If you’re taking profit, you can sell your position at the market closing time on the day that the pattern forms. This way, you can avoid selling for less when the price really falls the next day.

A general note:

Traders often use the Engulfing Candlestick pattern in conjunction with other technical analysis tools to confirm potential trading opportunities and make informed trading decisions. It is important to keep in mind that no single technical indicator or pattern is a guaranteed predictor of future price movements, and traders should always use risk management strategies to protect their capital.

Bottom line

  • The bearish engulfing candlestick indicates a change in the market sentiment from bullish to bearish.
  • The strong sell sentiment managed to drive the price down.
  • The pattern will often occur within two consecutive periods (usually days) in the market.
  • It’s identified by the first day which is a small green candlestick at the top of an uptrend followed by a massive red candlestick that soars high the next day.
  • Slight variation in price is negligible but be sure that small really means small.
  • A risk-taking trader would short sell on D2, meanwhile, a risk-averse trader would short sell on D3.

Do keep an eye out for our posts by subscribing to our channel and social media.

None of the material above or on our website is to be construed as a solicitation, recommendation or offer to buy or sell any security, financial product or instrument. Investors should carefully consider if the security and/or product is suitable for them in view of their entire investment portfolio. All investing involves risks, including the possible loss of money invested, and past performance does not guarantee future performance.

Written By

Become a AXEHEDGE investor today.