There are many stock chart patterns out there, and within that numerous patterns, there are more sub-patterns that traders usually use to predict whether the price of a stock would go up or down.
We will now discuss the different types of triangle patterns, what can you see from them, and how to not confuse the triangle pattern with pennant and wedge patterns.
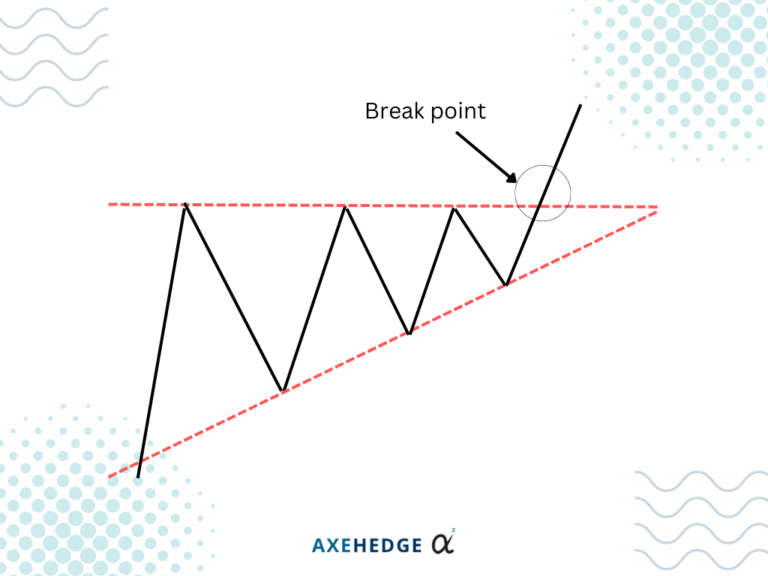
Well, the ascending triangle is a formation where the triangle points upwards, and it is a sign that perhaps the price may go up soon, once it breaks through the “breakout point” or as we like to call it: breakpoint/breaking point.
To identify this pattern, the upper trend line is usually horizontal while the lower trend line is moving upwards.
With ascending triangle, the price would have to break through the upper trend line for you to know that the game is on.
Why this pattern happens is that many people are starting to come in and put their money on the stock, slowly – and slowly, and then they are all tired of trying to be nice and a frenzy of buys happens, causing the price to soar upwards.
What people would usually do is that once the price breaks through the upper trend line, they’ll place their orders and watch the price soars before selling it during a point where they deem the price can’t push anymore.
The breaking point is where the price move beyond the pattern line, which shows that the price has now escaped the pattern, and the trend may be looking at a change – for good or for bad.
Do note, that sometimes it can go the other way around when the price breaks through the bottom trend line.
Descending
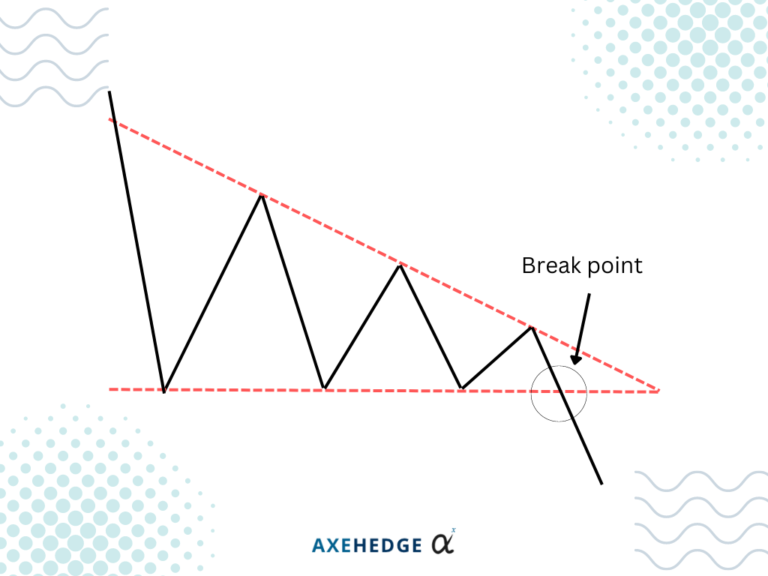
Much like the ascending triangle – except that this one moves down rather than up – this triangle pattern may show you when to sell or go short on the stocks.
In order to identify this pattern, the lower trend line is usually horizontal, while the upper trend line is moving downwards.
For a descending triangle, the price will have to break below the lower trend line, and then you know it’s time to buckle up for a possible ride downhill.
What happens during this pattern is that people are starting to sell this stock slowly, and once they realize that a trend is forming, they panic sell which caused the price to drop significantly.
Much like its ascending counterpart, this trend can go the other way around if the price breaks through its upper trend line.
Symmetrical:
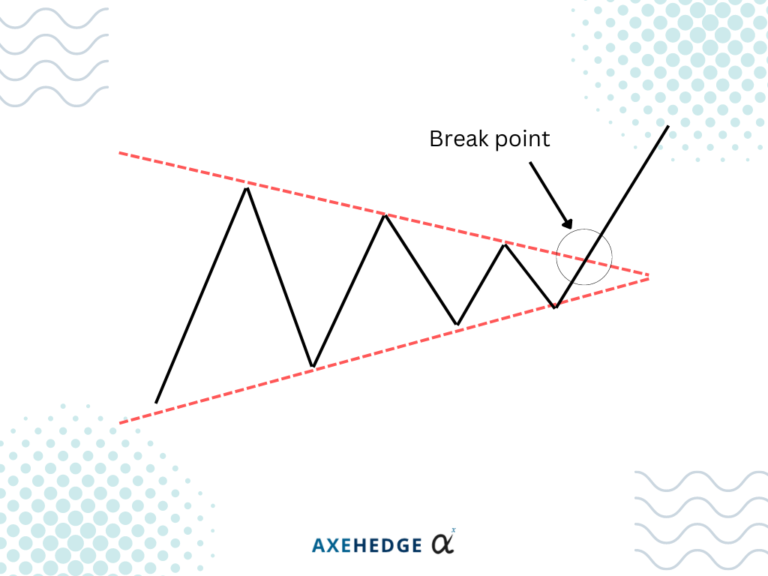
Unlike the ascending or descending trend line, the symmetrical triangle pattern is the realm of the unknown – but what is almost certainly known is that whichever the price breaks through, there will most likely be a price surge there.
If the price breaks through the upper trend line, then the price will most likely soar, and if it goes the other way, the next trend for the price will most likely be down.
The trend line for a symmetrical triangle pattern is moving towards one point, whereby if you draw a line in the middle of the two lines, the drawn line will move horizontally in the price chart.
What a symmetrical triangle shows you is that the market is really uncertain, but people are nervously anticipating it. It could go both ways, and in both situations, people are likely to go into a frenzy mode.
Unlike ascending triangle which you can have a good guess that the price may rise, or descend when it may fall, a symmetrical triangle dwells in the realm of uncertainty – thus, giving traders more thrills and anticipations.
The difference between Triangles, Pennants and Wedges
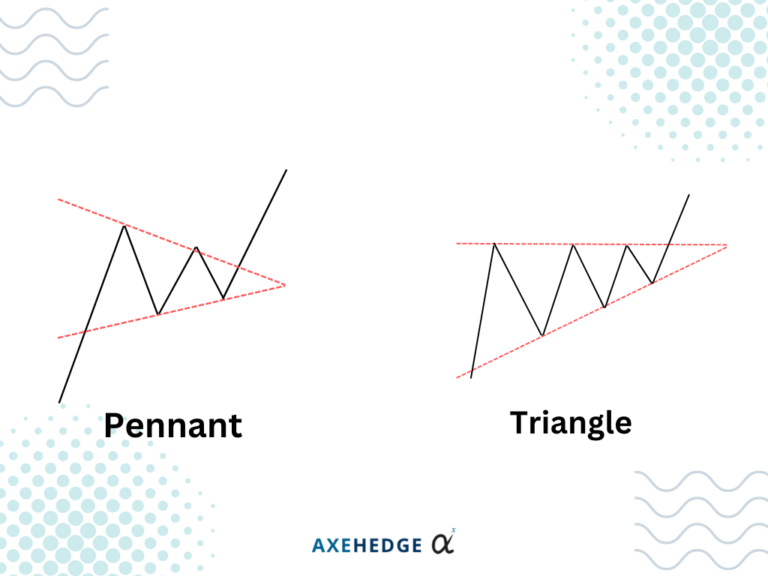
Triangle vs Pennant
We’ll talk about the pennant pattern first since it closely resembles a triangle pattern. The main difference between a triangle and a pennant is that pennant would consist of lesser candles (if you use candlestick chart), around 30 or fewer candles – in a simpler way, the pattern forms over a shorter period of time.
The triangle pattern, on the other hand, forms over a longer period of time.
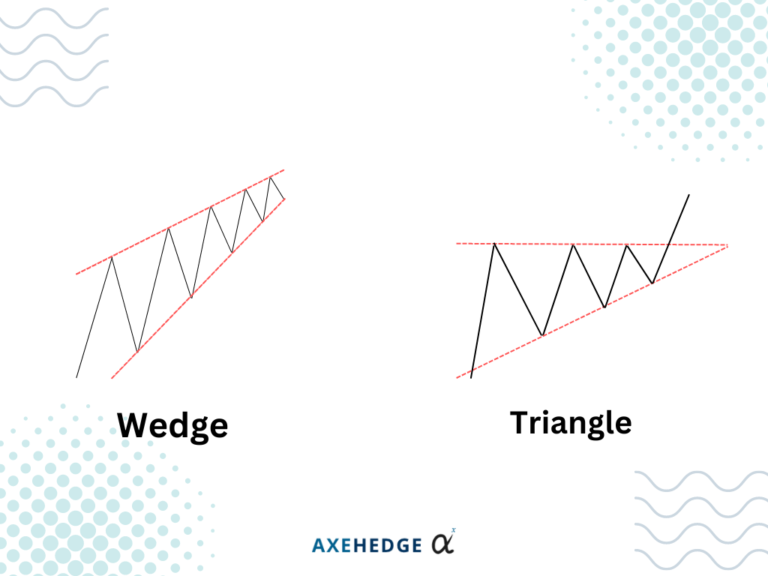
Triangle vs Wedge
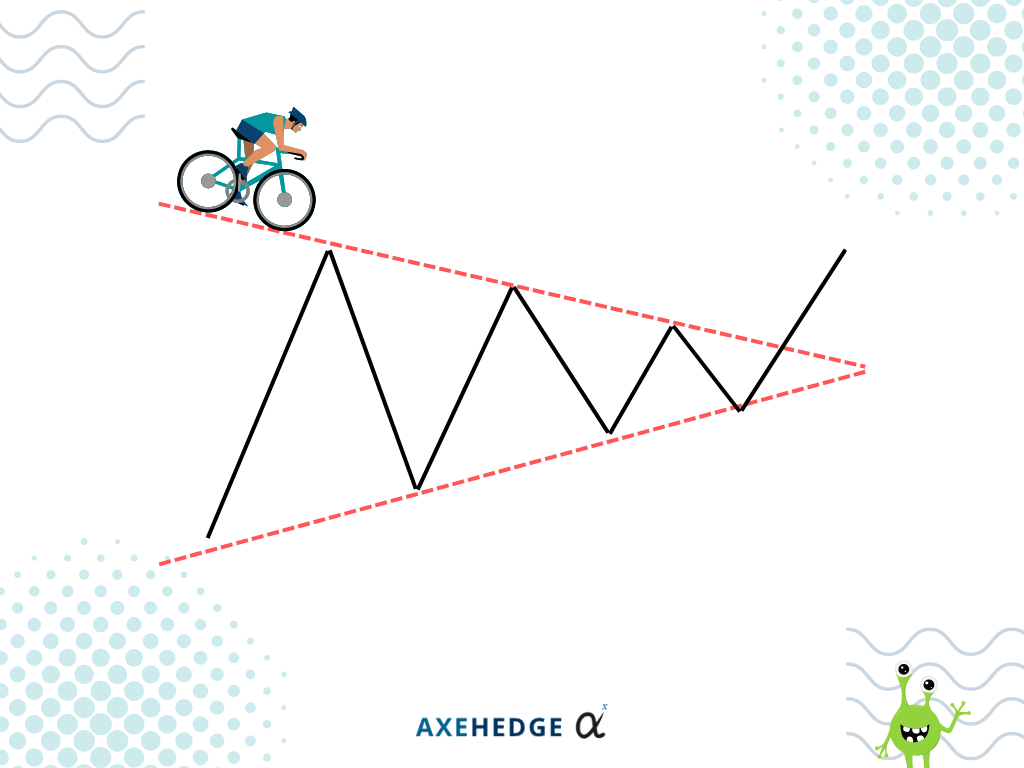
One of the easiest ways to identify the difference between a wedge and a triangle is that a wedge pattern will move upwards or downwards in a way that both its upper and lower trend lines are moving upwards or downwards.
If you compare an upward wedge to ascending triangle, or a downward wedge to a descending triangle, you can find that one of the trend lines for the triangle is horizontal, while both trend lines for wedges are moving in said directions.
Another thing is that when speaking of the wedge, see how the wedge pattern sort of tunnels upwards without any breakpoint? That is because we’re not looking for the breaking point in a wedge, but rather the formation of an upward/downward pattern itself.
Bottom line
Do note that identifying these patterns in the wild wouldn’t be as easy, and even if you do, there will always be a chance that the pattern doesn’t turn out as you thought it should. These patterns are essentially a collection of experiences of many traders who stumbled upon a usual trend.
To minimize your risk, you can also try to master your pattern-identifying skills while keeping your head abreast of the value investing methods. By combining the best of these two worlds, you can look at the charts and understand the reason behind them.
Do keep an eye out for our posts by subscribing to our channel and social media.
None of the material above or on our website is to be construed as a solicitation, recommendation or offer to buy or sell any security, financial product or instrument. Investors should carefully consider if the security and/or product is suitable for them in view of their entire investment portfolio. All investing involves risks, including the possible loss of money invested, and past performance does not guarantee future performance