AXEHEDGE

Risk Management: Introduction to Variance and Covariance

How learning about variance and covariance can help you manage risk?

Before this, we’ve spoken about the two main types of risk that you’ll have to deal with when you start investing/trading. Right now, we will look into two mathematical concepts that are used in investment/trading which are variance and covariance. These two concepts are useful in itself, and we’ll explain how later — but to give you more context, these two concepts will be useful once you’re talking about evaluating the level of risk for your whole portfolio.

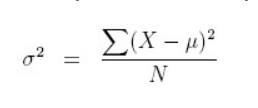
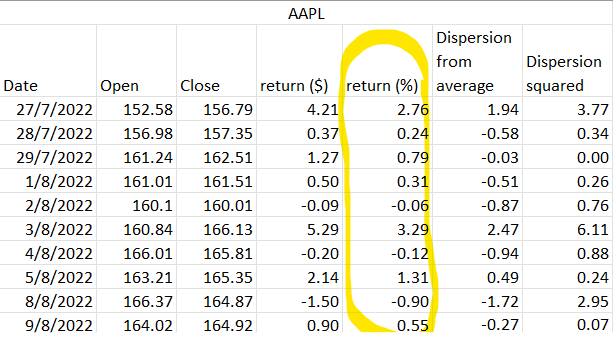
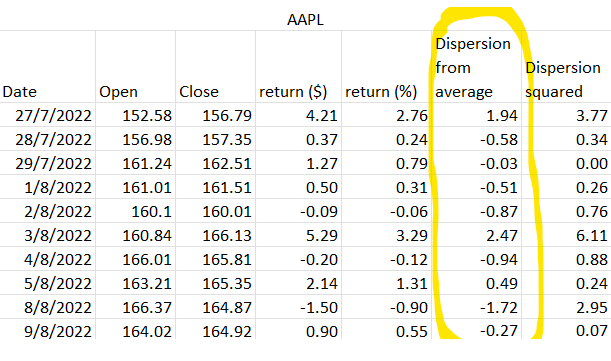
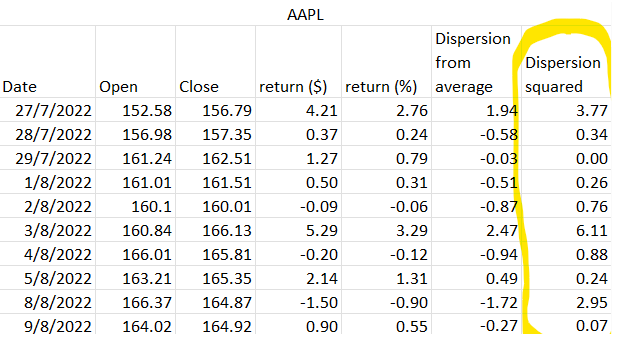
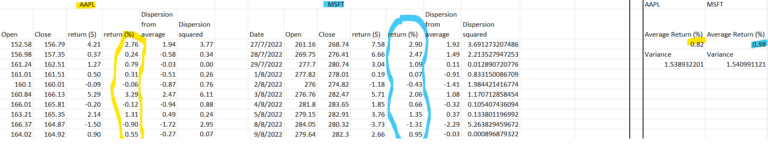
We’ll lay it down simply. The variance would usually tell you how an individual stock is doing, particularly how the returns (usually daily returns) would spread from the average expected returns. It tells you if an individual stock is a nutjob and would stray often from the objective, or if it’s a calm and collected piece of stock that would just linger around your target.

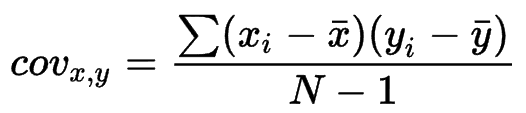
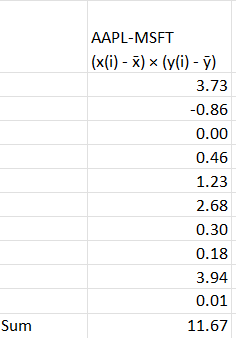
As for covariance, we actually wrote an article specifically on this once. We’ll try summing it in this article, but just to let you know, covariance tells you how one stock relates to another. For example, if Stock A moves up by 1%, will Stock B move up as well? If it does, by how much, and if not, how far apart will they move? This is particularly important when creating a portfolio. If you pick two stocks with a covariance of 1, for example, each stock is valued at $50. If Stock A falls by 10%, there is a high chance that Stock B will also fall by 10%. Most people would wanna balance out their stocks so that their portfolio is not lop-sized.

Here’s the question, covariance works if you’re comparing two stocks, right? Who on earth has a portfolio with only two stocks? Maybe some of you might, but a normal portfolio would have around 15–25 different stocks. How are you going to use variance or covariance on all of them? By using the variance-covariance matrix! But we won’t be touching on that yet, it’s lengthy and we’ll need time to prepare (mentally as well) for it.

For now, we’ll just waddle around variance and covariance.

Variance

Variance is a statistical measure that quantifies the dispersion or spread of returns for a particular stock or investment portfolio. It tells you the degree of fluctuation or volatility in the returns of a stock over a given period of time. A higher variance implies that the stock’s returns have experienced more significant fluctuations, indicating a higher level of risk.

The formula for variance is as follows:

σ² = Σ(x — μ)² / N

Where:

σ² = Variance

Σ (capital sigma) = it is a summation symbol, indicating that you need to sum up the values for each data point in the formula.

X = Daily return

μ = Average daily return

N = Number of observations (days)

By the way, if you square root the value of the variance, you’ll get the standard deviation for the stock’s returns, cool right? The standard deviation would tell you the range that the price would move, be it high or low.

Now, we’ll look at how variance works in real life. For this, we’ll look into Apple’s (AAPL) price from July 29th, 2022, to August 5th, 2022. We only use 5 days because it would look too long if we’re going to use the normal number of days, which depends on the investment period you want, but usually won’t be below 1 year… yep that’s a lot :’)

First, we look for the daily returns. We use percentages because it would be easier to compare two stocks that have massive differences in prices later.

From the daily return, we get an average (μ) of 0.82%. Now, calculate the first part of the formula which is the (x — μ) part, and you’ll get this:

Next, get the squared value, which is this:

By then, we’ve already finished the first part of it, which is (x — μ) ^2 or we call it as “Dispersion squared”. Now, all we need to do is sum it up and divide it by the number of days (N). You’ll get 1.538932201. Is that high… or is it low, or is it normal?

Well, when it comes to determining whether the value is good or not, it will depend on many things, such as the industry we’re looking at, the season, and more. In Apple’s example above, Apple is a tech company, so a variance value of around 1 or more is generally okay because tech companies are always in a race. In addition to that, we use Apple’s July data, which is during its earnings report season, which is when the price often fluctuates.

Again, it’s not a one-fit-all test, you’ll have to know the context first, and then you can decide if the value is high or not for that context. If you’re wondering whether Apple’s 1.53~ value is normal or not, we did the same calculation on Microsoft and we got around 1.54, so for tech companies, the number is quite normal — but tech is quite volatile compared to many other industries, so for some other industries such as staple foods, that kind of number might be considered high — and for some other sectors, it might even be considered low.

Now that we’ve settled on how to look for variance, we’ll look into covariance.

Covariance

For covariance, we’ll take snippets from our previous articles to easier explain it to you (and make our job simpler).

Covariance is essentially a statistical concept that measures how one thing corresponds with another — or you could also say how closely associated are the two.

In the context of investment, covariance measures the interconnectivity between two assets (usually stocks) by measuring how their returns move — to see if it is in correspondence or independent of one another.

This method is used to diversify portfolios by looking for companies that are not too closely interrelated. There are generally three results of covariance analysis — positive, zero, and negative. Positive means that they’re closely interrelated. The closer they are to zero will indicate the more unrelated they are, while zero stands as a “no correlation” value. A negative number means that they’re inversely correlated, which means that they move in different directions.

Covariance can be calculated by using the formula below:

Cov(x,y) = Σ (x(i) — x̄) (y(i) — ȳ) / N — 1

Where:

Cov(x,y) = covariance between x (asset 1) and y (asset 2)

Σ = Summation of all of the calculations.

x(i) = Day return of x (asset 1)

y(i) = Day return of y (asset 2)

x̄ = Average return of x (asset 1) over the period

ȳ = Average return of y (asset 2) over the period

N = number of data value (sample size)

For this example, we’ll use the same Apple stock with the same as period as before, and we’ll add Microsoft’s stock as well (MSFT), still within the same period.

To make things easier, we will look for the x̄ and ȳ values first (the average return for Apple and Microsoft). We get 0.82 for Apple and 0.98 for Microsoft.

Now, we can solve the Σ (x(i) — x̄) (y(i) — ȳ) of the equation and we’ll get a total of 11.67. What remains is 11.67/N-1.

In this case, we use 10-days data, so N=10. Hence, the calculation is:

Cov(x,y) = 11.67/(10–1)

Cov(x,y) = 1.29666666667

Rounding it off, we’ll get a 1.3 value, which means that the price for Apple and Microsoft move closely with one another, and they are positively correlated, which means that if Apple moves up, Microsoft will move up as well, and if one of them is down, it’s highly likely that your portfolio of these two stocks will tumble down.

Bottom Line

Variance sees how volatile a stock is in itself, while covariance looks at how two stocks correlate with each other. It’s like you’re looking at a dude, variance will tell you how crazy he is individually, while covariance can tell you that if this dude is going to meet another person, it’s either they are equally crazy (positive correlation), they have nothing in common (neutral or zero) or the other person is a saint compared to this dude (negative correlation). All of these are important in itself, but it’s more important later when you have to construct your portfolio.

To manage risk, you’ll have to look for stocks that suit your style. Some people can handle risky portfolios, some people can’t do it. For example, if you’re in your career’s speedy season, where money and bonuses are flowing in, you can afford to lose some money, so riskier assets are more suitable for you. If you’re already nearing retirement, you can’t afford to lose much then, because if you lose your money, you won’t have much time to rebuild again. Anyway, it will essentially remain to you to decide what kind of stocks get to be with you, and these tools are used to tell how these stocks are.

The key takeaways/market update is a series by AxeHedge, which serves as an initiative to bring compact and informative In/Visible Talks recaps/takeaways on leading brands and investment events happening around the globe.

Do keep an eye out for our posts by subscribing to our channel and social media.

None of the material above or on our website is to be construed as a solicitation, recommendation or offer to buy or sell any security, financial product or instrument. Investors should carefully consider if the security and/or product is suitable for them in view of their entire investment portfolio. All investing involves risks, including the possible loss of money invested, and past performance does not guarantee future performance.

Written By

BECOME AXEHEDGE INVESTOR TODAY