
The second triangle: the Descending Triangle
Read More

Well, this can actually come off a bit simple. What you will need are:
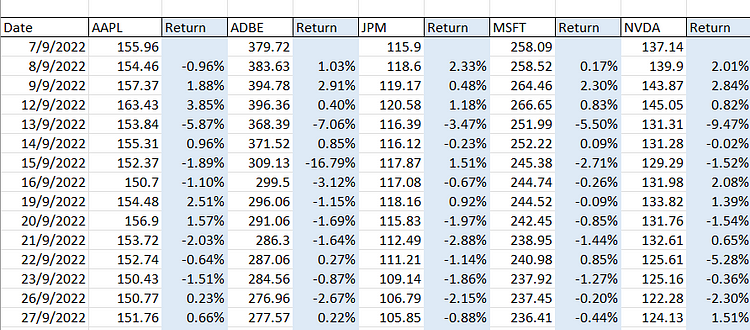
1. The average daily return for each stock.
We’ve discussed this previously, but simply, all you need to do is see the percentage of change for each stock every day during your observation period. In our case, we chose these stocks over the course of a few years. Just a glimpse of it:
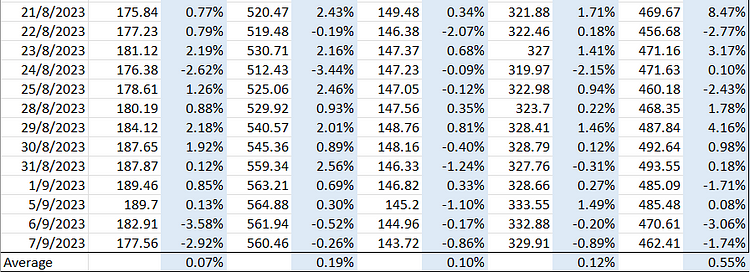
What we do next is look for the average daily returns for each stock. This is what it looks like:
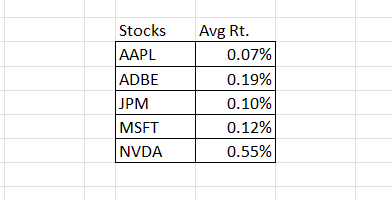
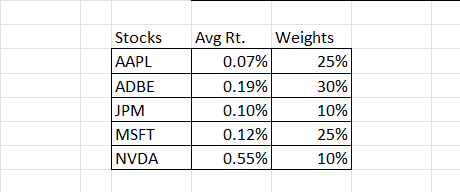
Now that we know the average daily returns for each stock over the course of one year (usually you’d need more than this, maybe 5 years, but we just use one year for the sake of making it simpler to teach), let’s arrange it in a proper table so it’d be easy to calculate things later on.
2. Weights of stocks in the portfolio
The weight of stocks in the portfolio depends on how much the stock values compared to the overall portfolio value. If Stock ABC is worth $10 out of a $100 portfolio, then its weight is 10% — because 10/100 is 0.10 or 10%. In our case, since we don’t use an actual portfolio, we made the weight up. Here are the made-up weights from our previous articles:
Now let’s put this into the table we just created alongside the average daily return.
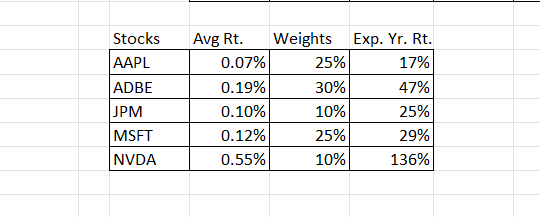
3. Expected annual return for each stock
Now, put the weights aside for a while and assume that you invested 100% of your money in only one of each stock from day one, over the course of one year — how would it look like? To do this, we will have to just multiply the average daily return of each stock by the number of days the market is open in a year. Here’s the formula:
Expected stock annual return = average daily return * number of days the market opens in a particular year
So, for 2023, our Google search made us believe that the market will be opened for 250 days in 2023, so it will be:
Expected stock annual return = average daily return * 250
This is how the updated table will look like:
We’ve now gotten the ingredients required to see how our overall portfolio may look like over the year. What you need to do is get the total sum of Each stock’s expected annual return times the stock’s weight in the portfolio. Here’s what the formula would look like:
Expected annual portfolio return = (Stock A Exp. Yr. Rt. * Stock A weight) + (Stock B Exp. Yr. Rt. * Stock B Weight) + …
P/S: The three dots “…” in the formula are just “and so on”, which means that if you have more stocks in the portfolio, then add them up as well using the same step.
In our case, this is what it’d look like:
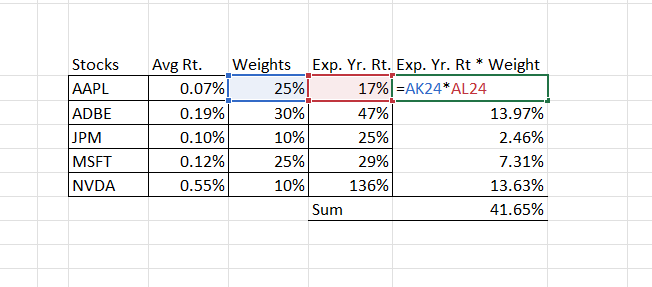
41.65% is the expected portfolio return over the course of one year of investing in this portfolio!
Easy, isn’t it? Of course, because that’s not all! We are just at the first step. However, don’t batter yourself up yet — even this is already a good milestone. Take some rest as we will get to the next steps in our later articles.

5 Common Mistakes Beginner Traders Make
Things to avoid when you’re just starting to trade
Read More
Trading Dow Pattern the Triangle Pattern (Part 1)
The first triangle: the Ascending Triangle
Read More
Funds: Equity Funds (Part 3)
How to choose between equity funds based on companies’ earnings...
Read More