

The second triangle: the Descending Triangle
Read More
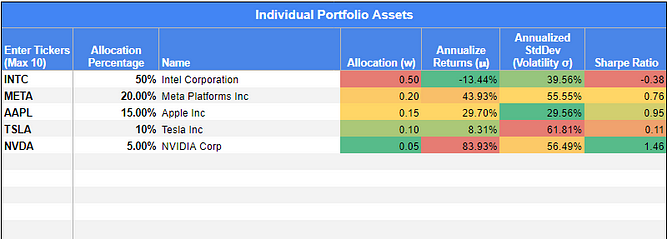
You can skip all of these lessons and head straight to this Google sheet file. All you need to do is fill in the ticker name for the stocks that you have and their weight. All credit for the sheet file goes to John Mihalik who published it on his Medium page.
By the way, the weight is how many percent of your portfolio the stock constitutes. For example, the total money you allocated to invest is $1,000. Out of that $1,000, $100 is invested in Stock A. So, Stock A’s weight is 10% ($100 out of $1000 is 10%).
These are some of the things that are included in the Google sheet file:
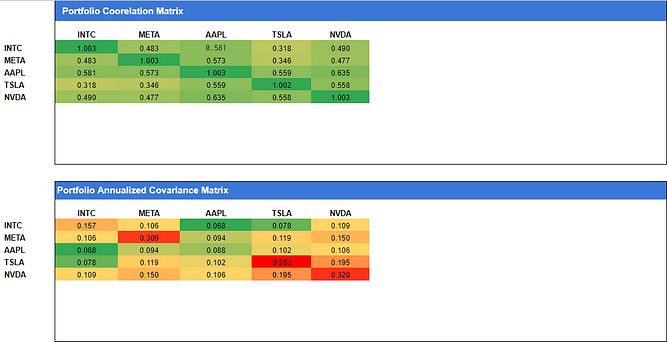
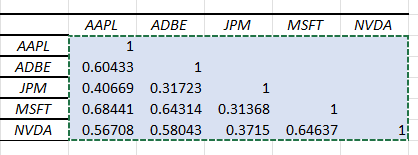
It’s super helpful! You can see from the example above how different stocks in your portfolio correlate to one another, like how INTC and META have 0.483 in correlations.
The key to risk management is to make sure your stocks are diversified so that some stocks shouldn’t be strongly correlated to another. If a few of them are, it’s okay, but make sure not too many of them are strongly correlated — that would mean that your portfolio is not diversified well.
If getting to it is all you need, the stuff above is already enough for your needs. If you want to know how to do it, or you want to have more than just 5 stocks in the matrix, then stick around!
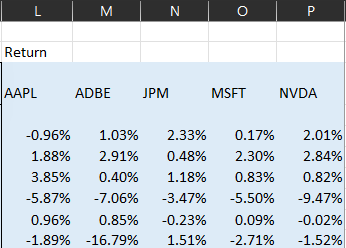
By data, we would usually use the closing price for each stock. In this example, we are using the closing price for five stocks: Apple (AAPL), Adobe (ADBE), JPMorgan (JPM), Microsoft (MSFT), and Nvidia (NVDA).
You can get this anywhere, but the easiest way is to head to Yahoo! Finance. You can download the historical price sheet for free. As for this example. We will use the data from September 7th, 2022 to September 7th, 2023.
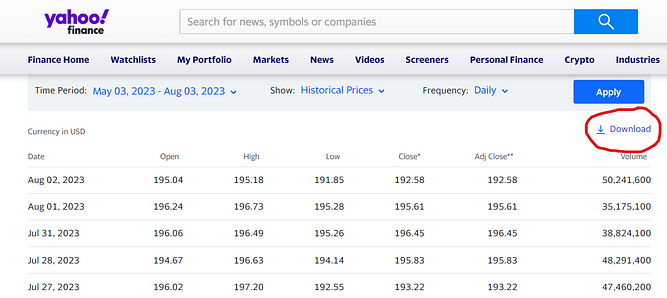
Below you can see how we did it (of course, you can do it your own way). The price extends until September 7th, 2023, but we don’t have enough space for that, but the ones below would do the trick hopefully.
To calculate daily returns, just use the formula below:
Return = (Day 2 Price — Day 1 Price)/Day 1
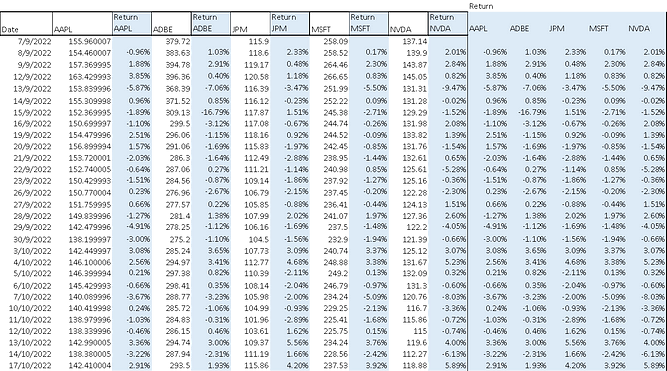
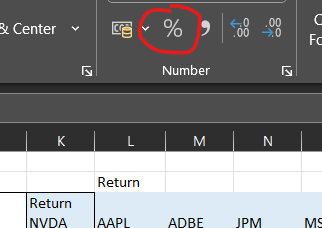
Once you get the return, change it into a percentage by using the function below (we are using MS Excel by the way).
Do note how we arrange all the returns on the right side of the table. This will make it easier for us to do the Excel stuff later on.
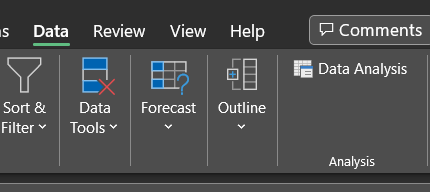
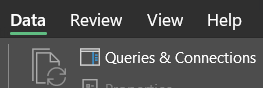
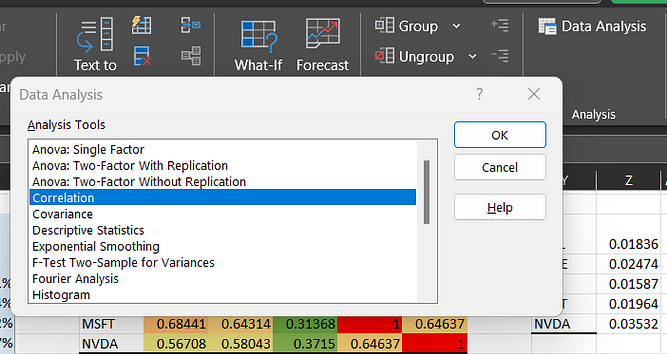
Now, in your MS Excel, look at the “Data” tab, and look for the “Data Analysis” function per above. If you can’t find it there, then enable it using the simple steps below:
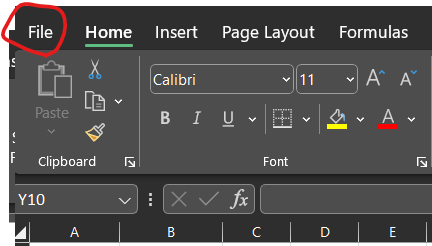
Go to the “File” tab
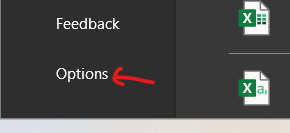
Head over to “Options”
Go to “Add-Ins” tab
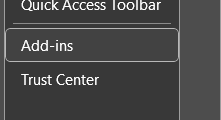
Then head over to “Excel Add-ins”
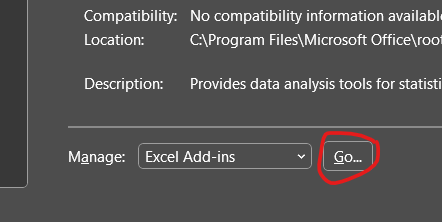
Check this box and press “OK”
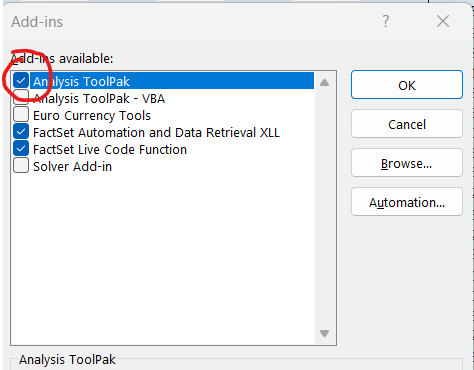
You will now have the Add-ins enabled. (Don’t ask me why they don’t automatically enable it the moment you install the software).
To do this, follow these simple steps:
Head to the “Data” tab
Click on the “Data Analysis” function and then click on the “Correlation” option. Press “OK”.
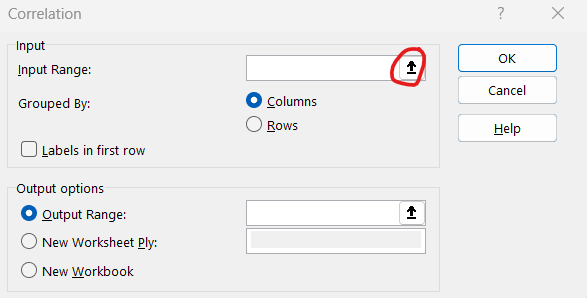
You will see this tab. Click on the ‘arrow’ looking button to select your input range.
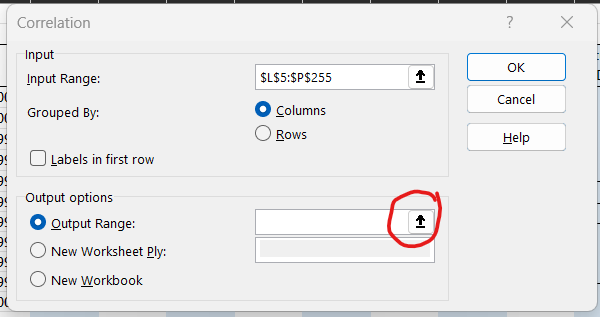
Now, select all of the returns value that we have arranged beforehand. (we just show 6-days value but actually select all of them, all 1-year worth of data).
Also, you can also select the stock name if you want (the “AAPL”, “ADBE”, etc.), just make sure to select the “Labels in first row” checkbox if you do.
Next, select an output range. This is where you’d want to have the matrix presented. Make sure you allocate enough space. (For 5 stocks it would be around 6 by 6 cells including the label, I think).
You will then get this:

Are we done? Yes, but there would be a little bit more step to make it a proper matrix table for our next use, which is when we want to calculate the whole portfolio variance, the final step to see how well diversified your portfolio is.
What you want to do is select all the values in the correlation matrix table, and press “Copy”.
Next, select another blank area and right-click. Select “Paste Special”. Then tick on the “Values and number formats” and “Transpose”.
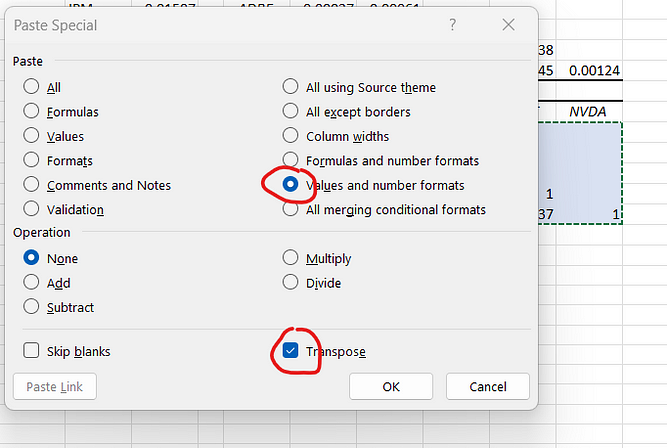
You will now have this:
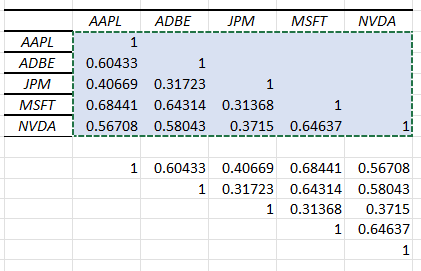
Note: if you look carefully, they are the same number but in an inverted form.
Then, select the new numbers that you have produced (in our example above, they’re the inverted version at the bottom), and click “Copy”.
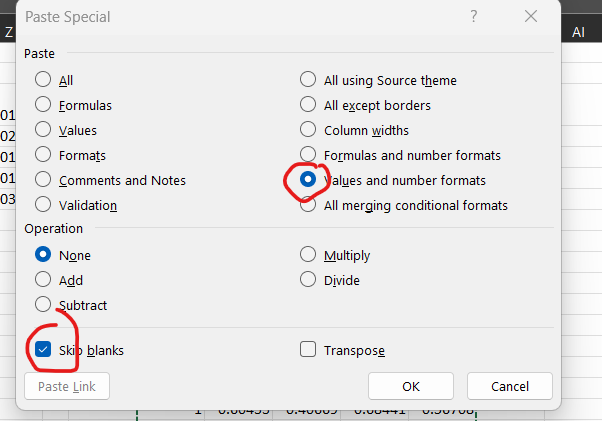
Now, click on the first cell in your matrix table (in our example, it is AAPL-AAPL, the one with value “1”), right-click, and press “Paste special”. In the Paste Special menu, check the “Values and number formats” and “Skip blanks” checkbox like shown below. Then click “OK”.
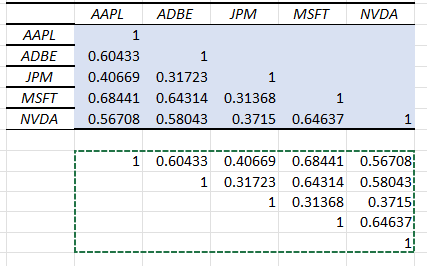
Ta-da! You will now get this:
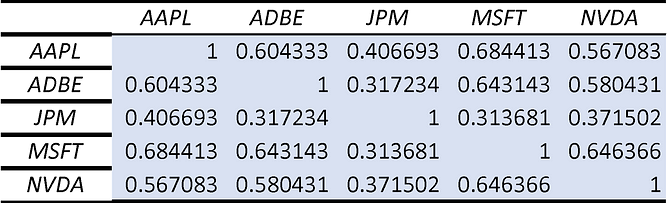
This is the proper correlation matrix table that you will need for the final step, which is to look for the Portfolio Variance value. We will get to that in our next article. Hehe.
Oh, and here’s a link to our Excel file if you want to play around with it.

5 Common Mistakes Beginner Traders Make
Things to avoid when you’re just starting to trade
Read More
Trading Dow Pattern the Triangle Pattern (Part 1)
The first triangle: the Ascending Triangle
Read More
Funds: Equity Funds (Part 3)
How to choose between equity funds based on companies’ earnings...
Read More