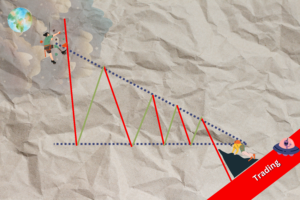
AXEHEDGE

Risk Management: Portfolio Variance

An easy guide on how to see if your portfolio is well-diversified.

Before this, we went through the guide on how to look for a Correlation Matrix to see how well-diversified each stock in your portfolio is in relation to one another. Now, we want to look at your portfolio as a whole and see your Portfolio Variance value — which is kind of like a ‘score’ for your portfolio diversification.

Portfolio Variance?

Portfolio variance calculates how much the returns of these individual assets in your portfolio fluctuate or vary together. If the returns of the assets tend to move in the same direction at the same time, it increases the portfolio’s overall risk. Conversely, if they move in opposite directions, it can reduce the overall risk.

It’s a key tool in managing risk and making strategic investment decisions. Lower portfolio variance generally indicates lower risk, while higher portfolio variance suggests higher risk.

Step 1: Get the correlation matrix for your portfolio.

We won’t be discussing in detail how to do it, if you’re interested to know how to do it, you can head over to our article below:

Risk management: Correlation Matrix

From the previous calculation, we have this as our Correlation Matrix:


Step 2: See the weights of your stocks in your portfolio.

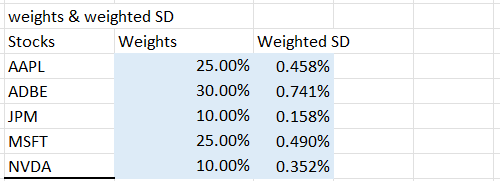
The weight of the stock in your portfolio is simply how much percent of your total portfolio value the stock contributes to. If you have $1,000 in terms of Portfolio Value and Stock A’s value is $100, then Stock A’s weight is 10% in the portfolio.

Weight = Stock Value / Portfolio Value * 100

From our previous calculation, we assign these weights to our stocks:

Note: We just made the numbers up. When actually doing it, be sure to calculate it properly.

Step 3: Get the Standard Deviation for each stock’s returns.

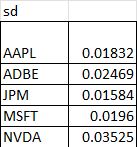
To do that, you must first calculate the Standard Deviation for each stock’s return. We do it in MS Excel using the =SDEV function and then highlight all the returns for a particular stock.

This is what we came up with:

Step 4: Calculate the Weighted Standard Deviation Value for each stock.

The formula for Weighted Standard Deviation (Weighted SD) is as follows:

Weighted SD = weight of a stock * standard deviation of a stock

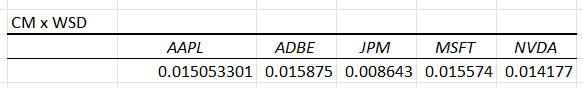
Now that we already have both the weights and the standard deviation, this is the result:

Step 5: Transpose the Weighted SD with the Correlation Matrix

Now, select an empty space in your MS Excel file and create the ‘placeholder’ for the result. It would look something like this:

Now, highlight all of the empty space (from AAPL to NVDA), insert the following equation:

=MMULT(TRANSPOSE(range of Weighted SD), range of the Correlation Matrix)

In our case, it would look something like this:

 
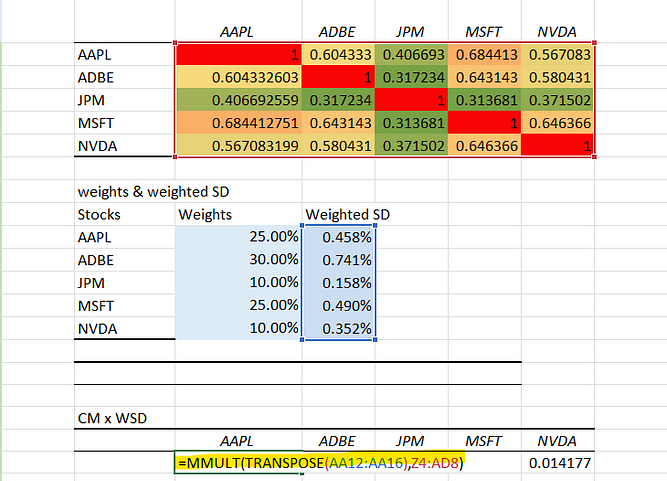
This is how the result would look like:


Step 6: Multiply the value in Step 5 with the Weighted SD

Select any empty space in your MS Excel sheet, and use this formula:

=MMULT(range of value in CMxWSD tablerange of value for weighted SD)


This is the result that we get:

0.000326514

Step 7: Get the Square Root for the value in Step 6

Now, get the square root for 0.00032782. In Excel, you can just use the function =SQRT.

The result is 1.81%.

Step 8: That’s it.

Yep, the 1.81% you get above is all there is to it. A value of 1.81% usually indicates that they’re strongly correlated.

However, for those who are really nuts with risk-taking, a portfolio variance of around 3% to 5% is okay with them.

Those who are more on the moderate side will look for something between 1% to 1.5%.

Those who are playing safe would go for something around 0.5% to 1%.

Bottom Line

  • Portfolio variance calculates how much the returns of these individual assets in your portfolio fluctuate or vary together.
  • If the returns of the assets tend to move in the same direction at the same time, it increases the portfolio’s overall risk, and vice versa.
  • A portfolio variance of around 3% to 5% is okay with high-risk-takers.
  • Those who are more on the moderate side will look for something between 1% to 1.5%.
  • Those who are playing safe would go for something around 0.5% to 1%.

The key takeaways/market update is a series by AxeHedge, which serves as an initiative to bring compact and informative In/Visible Talks recaps/takeaways on leading brands and investment events happening around the globe.

Do keep an eye out for our posts by subscribing to our channel and social media.

None of the material above or on our website is to be construed as a solicitation, recommendation or offer to buy or sell any security, financial product or instrument. Investors should carefully consider if the security and/or product is suitable for them in view of their entire investment portfolio. All investing involves risks, including the possible loss of money invested, and past performance does not guarantee future performance.

Written By

BECOME AXEHEDGE INVESTOR TODAY