How to measure your overall portfolio performance using equity curve.
Before this, we’ve discussed how to see if your portfolio is well-diversified by looking into the Portfolio Variance. Now, we will look into how to construct an equity curve, a graph chart showing how your portfolio performs over time. By using this graph, you can see how much your overall portfolio performance is.
Before we start…
We’d like to inform you that we use MS Excel for the calculations, and the calculations herein will be based on the calculations that we already had in our previous articles. You can download our MS Excel file if you want. You can also use it to practice with the method that we are going to put forward
A quick recap
Before we start, under the topic of Risk Management, we have looked at these things:
To sum things up, you can see how well diversified your portfolios are starting by looking at the Variance Covariance Matrix, Correlation Matrix, and then Portfolio Variance. However, you can cut straight to the chase by skipping the first step (Variance Covariance Matrix). In fact, the first one is the ‘manual’ step so it’s a bit prone to (negligible) errors.
What is an equity curve?
An equity curve is a graphical representation of the performance of an investment or trading strategy over time. It is a visual tool that displays the cumulative returns or changes in the value of an investment or trading account as each trade or investment decision is made.
This is how it would look like:
Now, how to get the equity curve?
Enough chit-chat, here are the steps needed for you in order to get the equity curve:
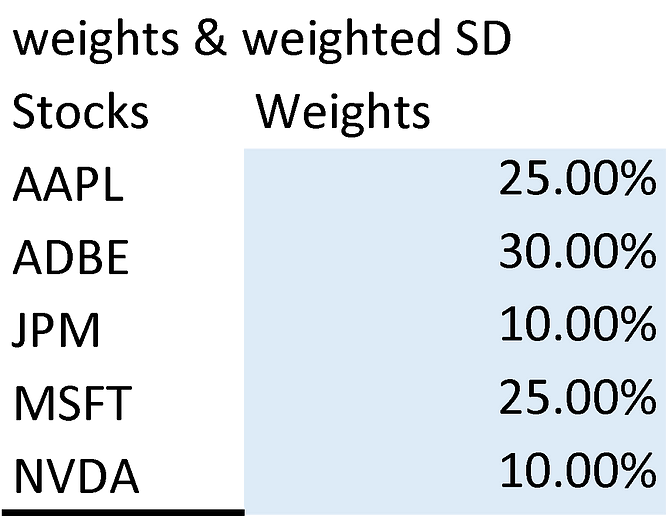
Step 1: Determine the weight of each stock in your portfolio
The weight of each stock would depend on how much the stock makes up in your portfolio. It’s best to use the initial value of your investment. In our example, we imagine that we have $100 to invest with, and we use that money as follows:
AAPL: $25
ADBE: $30
JPM: $10
MSFT: $25
NVDA: $10
So, the weight of each stock would be as follows:
Question: No one really invest exactly $100 over various assets. There would at least a bit more or less to the amount. How should that work?
If we look at the actual price of all the stocks above at the time this article is written, and assuming we buy one of each stock above, here is how it’s going to look like:
However, when constructing an equity curve, it would be helpful to take the weight and assume that it’s used on a $100 value. The movements in the graph can be easily translated into percentages.
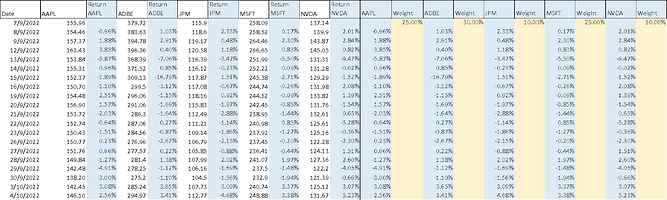
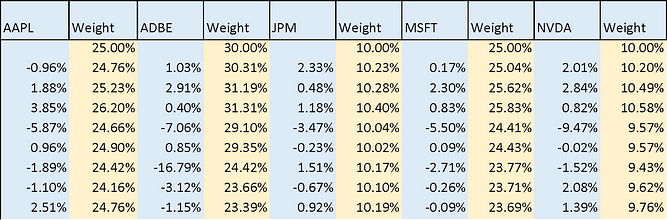
Step 2: Insert the stock weight and sum invested in your MS Excel table
The way that we put it is that we put the weight right beside the return rate (it would be easier to do the calculations later). This is what it looks like in our case:
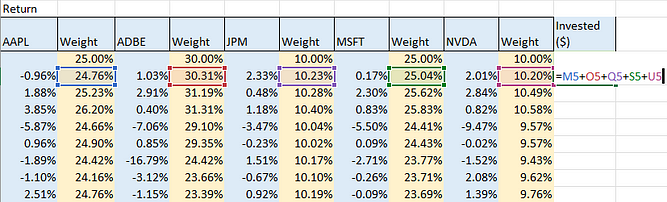
Oh, and also add the investment total in the table. We will need this for the graph plotting later. We would suggest you put it under the denomination of 100, for easier observation.
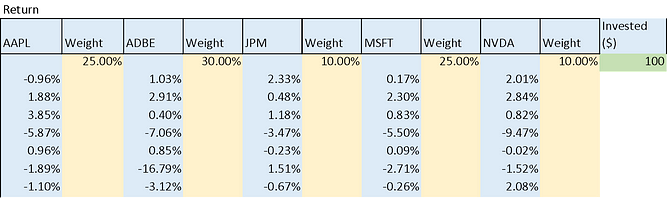
Step 3: Factor in the changes in return to the weight
Hot damn that sounds so complicated. It’s not. What you need to do is use the formula below:
New weight = Previous Weight x (1 + Change in the rate of return)
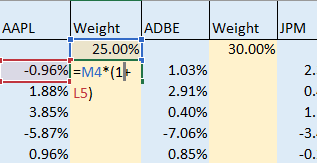
In our example, you can see that the first empty spot in AAPL (the one next to -0.96% above), would look something like this:
New weight = 25% x (1 + (-0.96%))
New weight = 24.76%
Now, do that for every other “Weight” column as well.
This is what we got (this is just a snippet, it’s too big to show everything):
Step 4: Sum up all the new weights for each day
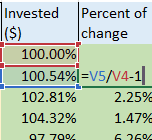
So, what you need to do is sum up the percentage of change for each day, this is how it looks like in our calculation:
What we did is that we summed all the new weight in a new column, the result for day 2 is 100.54%, which means that our portfolio has grown by 0.54% in just 1 day. If you have invested $1,564.65 as we mentioned above, you would now have $1,564.66 — $0.01 more!
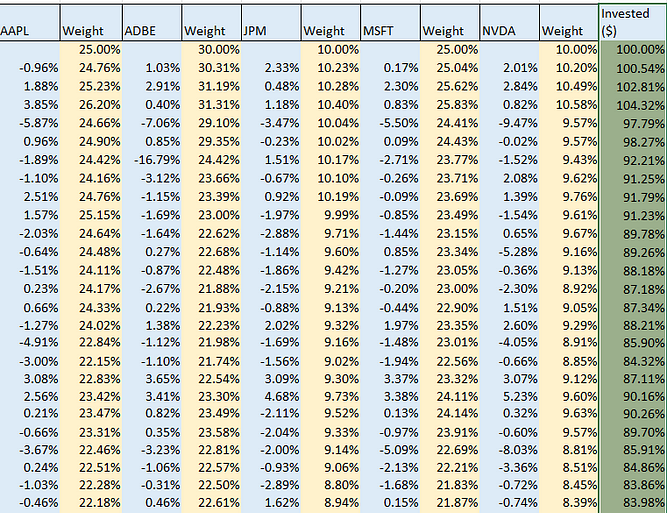
Now, drag the bar and see the calculations for your period of observation.
From the “Invested ($)” column, you can create the equity curve.
Step 5: Create the equity curve
What you want to do is highlight the “Invested ($)” column while also highlighting the date (you can do this by holding the “CTRL” key). Then click on the “Insert” bar on your MS Excel, and click on the charts you like. I don’t like to waste my time so I would just click on the “Recommended chart” and pick the best suggestion.
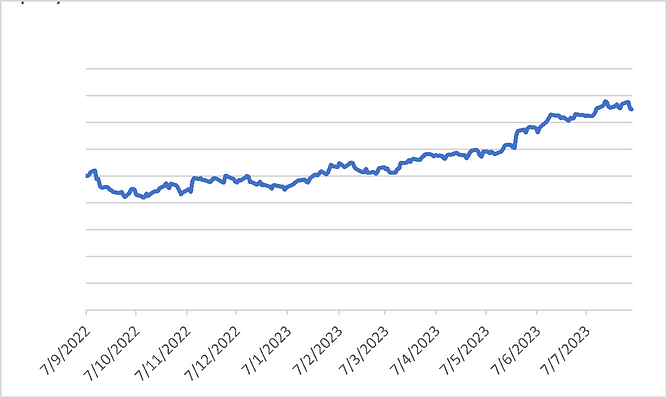
This is the equity curve that we got from the portfolio:
Increased by more than 40% in one year. Not bad!
Oh, another thing…
If you calculate the percent of change in the portfolio, you can get the Portfolio Variance!
What you need to do is calculate the percentage of changes in the portfolio invested per above, insert the equation “=STDEV.P” and then highlight the “Percent of change” values, and just click ENTER.
However, the value might not be the same given that the methods used are different, but the difference is usually very minimal and negligible.
In this case, we got 1.86% as the Portfolio Variance.
In our previous article, we got 1.81% as the Portfolio Variance.
Bottom Line
An equity curve is a graphical representation of the performance of an investment or trading strategy over time.
It is constructed by looking at how each stock in the portfolio moves, having factored in their respective weights.
The end result may be more or less than 100.
If it exceeds 100 it means that your portfolio has grown, and if it is below 100, it means that your portfolio has shrunk in value.
You can calculate Portfolio Variance using the parts of calculations in the equity curve construction.
The key takeaways/market update is a series by AxeHedge, which serves as an initiative to bring compact and informative In/Visible Talks recaps/takeaways on leading brands and investment events happening around the globe.
Do keep an eye out for our posts by subscribing to our channel and social media.
None of the material above or on our website is to be construed as a solicitation, recommendation or offer to buy or sell any security, financial product or instrument. Investors should carefully consider if the security and/or product is suitable for them in view of their entire investment portfolio. All investing involves risks, including the possible loss of money invested, and past performance does not guarantee future performance.