
The second triangle: the Descending Triangle
Read More

Short Position:
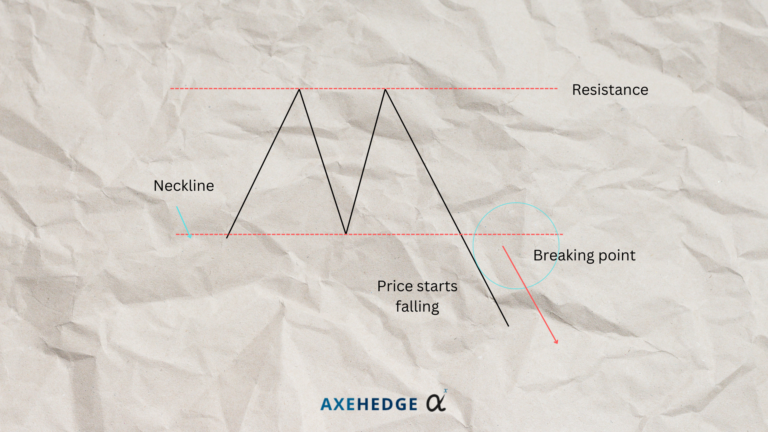
Traders typically enter a short (sell) position when the price breaks below the neckline, confirming the completion of the double top formation and signaling a potential trend reversal. This is when you place your short sell.
Just in case things doesn’t work out, where do you place your stop loss? You’d usually want to put your stop loss just a bit above the second peak.
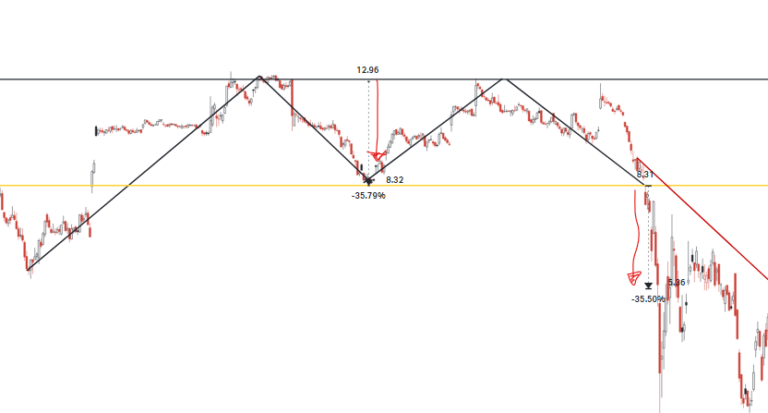
Where can you start taking profit? The key is to draw a line vertically to measure the distance between the neckline and the height of the two peaks.
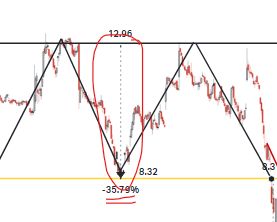
In this example, we can see that the distance is around 35%. So, what you can do is drag the line to go around 35% below the neckline. That is how much it is likely for the price to drop.
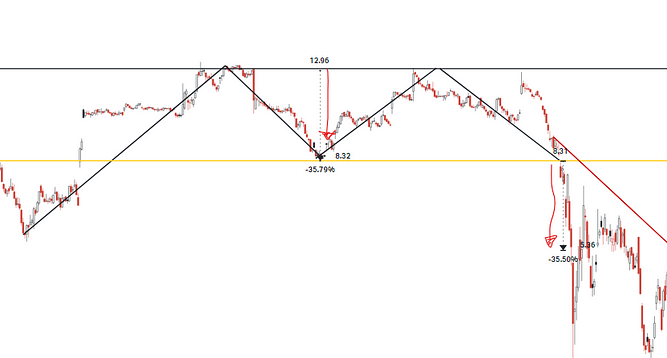
So, for this example, 35% below the neckline is around a decrease from $8.32 to $5.36. Of course, the stock dropped deeper in this example, but you can never be too sure, right?
Profit-Taking (for long position):
If you already own positions in the stock or asset, you might want to let go of that position (depending on your strategy) and start taking profit from your position, if you bought it at a lower price prior to the trend taking place.
P/s: Assess the risk-reward ratio before entering the trade. Ensure that the potential reward justifies the risk taken.

5 Common Mistakes Beginner Traders Make
Things to avoid when you’re just starting to trade
Read More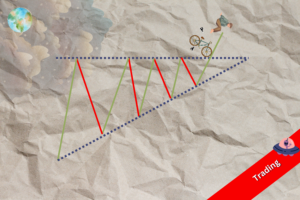
Trading Dow Pattern the Triangle Pattern (Part 1)
The first triangle: the Ascending Triangle
Read More
Funds: Equity Funds (Part 3)
How to choose between equity funds based on companies’ earnings...
Read More