AXEHEDGE

Trading: How to trade by reading the Dow Pattern (Part 1)

How do you place your trade by looking at the Head and Shoulder Chart Pattern?

Just as a quick recap, this is a continuation of a stock chart trading series we discussed in our previous article. Previously, we’ve looked into the basic principles under the Dow Theory. Now, we will look at how this theory appears in the wild, and how traders use these “Dow Patterns” when making a trading decision. This article will look at one of such formations, the Head and Shoulders Pattern.

Refreshing our understanding of the Dow Theory

Under the Dow Theory, a few basic rules may indicate if the Dow Pattern is forming, i.e., it tells you if it’s a good time to buy, sell, or hold — much like trying to see if it’s going to rain, the sky gets dark, the air feels humid, and clouds are forming! So, here are the 6 basic tenets of Dow Theory:

  1. Market moves in 3 broad trends.
  2. There are 3 phases under each trend.
  3. Everything is discounted into the stock market.
  4. Averages must confirm each other
  5. Volumes must confirm trends
  6. Trends will continue until there is a reversal

The ones that we will cater to the most during the pattern identification process are the first and second tenet. How? Let’s find out together as we go.

Head and Shoulders Pattern

field of stock trading and other financial markets. It is considered a reversal pattern, signaling a potential change in the trend of an asset. What that means is if the market is bullish (upwards), it’s about time for it to fall, and if it’s bearish (downwards), it’s about time for it to rise.

The pattern is named for its appearance, which resembles a human head and shoulders (but give them some space, traders might be a bit liberal with their artistic values).

The two kinds of Head and Shoulder Patterns

Head and Shoulders Top: A reversal pattern indicating a potential change from an uptrend to a downtrend.

Head and Shoulders Bottom (Inverse Head and Shoulders): A reversal pattern indicating a potential change from a downtrend to an uptrend.

Head and Shoulders Top

It typically consists of three peaks: a higher peak in the middle (the head) flanked by two lower peaks on either side (the shoulders).

Here are a few characteristics of Head and Shoulders Top you must remember:

The pattern is formed as an uptrend reaches its peak and is followed by a retracement, creating the left shoulder. The subsequent rally forms the head, often reaching higher than the previous peak. Another retracement results in the formation of the right shoulder, which is usually lower than the head.

The neckline connects the lows of the troughs between the peaks. The completion of the pattern is signaled when the price breaks below the neckline, indicating a potential trend reversal from bullish to bearish.

What happens behind the movements?

  • In the initial stage, the left shoulder is formed as the price rises to a peak but then encounters selling pressure, leading to a temporary decline.
  • The subsequent rally creates the head as buyers regain control and push the price to a higher peak. The subsequent rally creates the head as buyers regain control and push the price to a higher peak.
  • The right shoulder forms as the price attempts to rally again but fails to reach the height of the head. This failure suggests waning bullish momentum, and sellers gain control, causing the price to decline once more.
  • The neckline, connecting the lows between the peaks, serves as a critical support level. When the price breaks below this neckline, it signifies a breach of support and often triggers a cascade of selling as traders interpret it as a signal to exit long positions or enter short positions.
  • TLDR; the first shoulder is when the market is hopeful. They stayed patient and as the head came, they were considering if that was the rally, but it dipped again, and as the last shoulder formed, they gave up on the rally and decided it is not going to make it.

How to trade?

Short Position:

Traders typically enter a short (sell) position when the price breaks below the neckline, confirming the completion of the Head and Shoulders pattern and signaling a potential trend reversal. This break below the neckline is considered a sell signal.

To estimate a target for the price decline, measure the distance from the head to the neckline. This distance is then subtracted from the neckline’s breakout point. Identify potential support levels on the way down, such as previous lows or significant technical levels.

In the example, the difference between the neckline and the top of the head is at around 9%, so one would usually set their target at 9%. In this particular example, however, the dip went by around 14% from the neckline over the course of around one month.

Stop-Loss (for short position):

Above the Right Shoulder: Place a stop-loss order slightly above the right shoulder, or around that price range. This helps mitigate the risk of a false breakout or a temporary retracement before the downtrend resumes.

In this example, it would be somewhat around $180. If you did that (in this particular example), the stop loss would not be triggered yet, and the stock would fall and you are set to gain from your short position.

Profit-Taking (for long position):

If you already own positions in the stock or asset, you might want to let go of that position (depending on your strategy) and start taking profit from your position, if you bought it at a lower price prior to the trend taking place.

P/s: Assess the risk-reward ratio before entering the trade. Ensure that the potential reward justifies the risk taken.

Head and Shoulders Bottom (Inverse Head and Shoulders):

It typically consists of three troughs: the lowest trough in the middle (the head) flanked by two lower troughs on either side (the shoulders).

Here are a few characteristics of Head and Shoulders Bottom you must remember:

The pattern is formed as a downtrend reaches its low point, resulting in the formation of the left shoulder. A subsequent decline creates a lower trough, forming the head, often dipping lower than the previous low. The right shoulder is then formed as the price rebounds but does not surpass the level of the left shoulder.

The neckline connects the highs between the troughs. The completion of the pattern is signaled when the price breaks above the neckline, suggesting a potential trend reversal from bearish to bullish. Traders often interpret this pattern as an opportunity to enter long positions and ride the expected uptrend.

What happens behind the movements?

  • The Head and Shoulders Bottom Chart pattern reflects a shift in market sentiment from bearish to bullish.
  • In the initial stage, the left shoulder is formed as the price declines to a trough but encounters buying interest, leading to a temporary rebound.
  • The subsequent decline creates the head as sellers regain control and push the price to a lower trough, often below the previous low.
  • However, this lower level attracts increased buying interest, resulting in another rebound.
  • The right shoulder forms as the price attempts to decline again but fails to reach the depth of the head.
  • This failure suggests diminishing bearish momentum, and buyers gain control, causing the price to rise once more.
  • TLDR; after ‘failing’ to fall so many times, people think the demand is quite strong and the stock will likely rise.

How to trade?

Long Position:

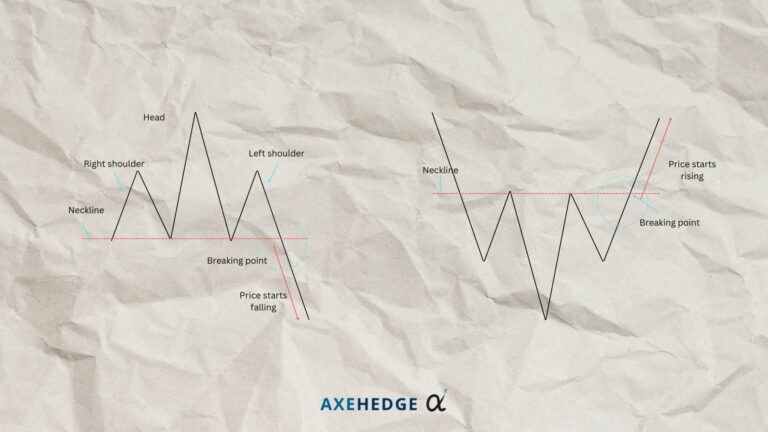
Traders typically enter a long (buy) position when the price breaks above the neckline, confirming the completion of the Head and Shoulders Bottom pattern and signaling a potential trend reversal. This break above the neckline is considered a buy signal.

Stop loss:

Place a stop-loss order slightly below the right shoulder. This helps mitigate the risk of a false breakout or a temporary retracement before the uptrend resumes.

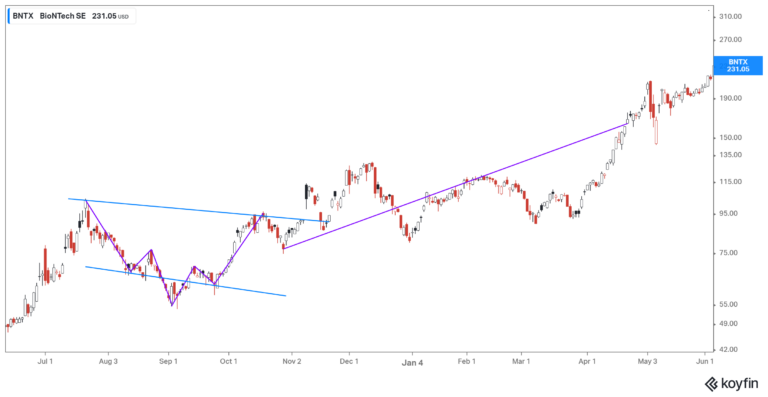
In the example, say, the price of the stock at the shoulder is around $66, so if you move a bit lower, perhaps the stop loss can be put at around $63.

Profit-Taking:

To estimate a target for the price rise, measure the distance from the head to the neckline. This distance is then added to the neckline’s breakout point. Traders often use this measure as a potential target for their profit-taking, anticipating a move of similar magnitude to the upside.

Usually, people would target the price to go around the distance between the neckline and the head, which in the example above is around 33%. So, if you buy it just as the share price is breaking above the neckline, you’d buy it at $66 and sell it at around $88.

In this particular example, however, the rally continued (given how the company was involved with the Covid-19 vaccine at the time), but just because this example shows a rewarding outcome of holding, it doesn’t mean you should always do that. Stick to your plan, whatever that is that you decided on.

Resistance Levels:

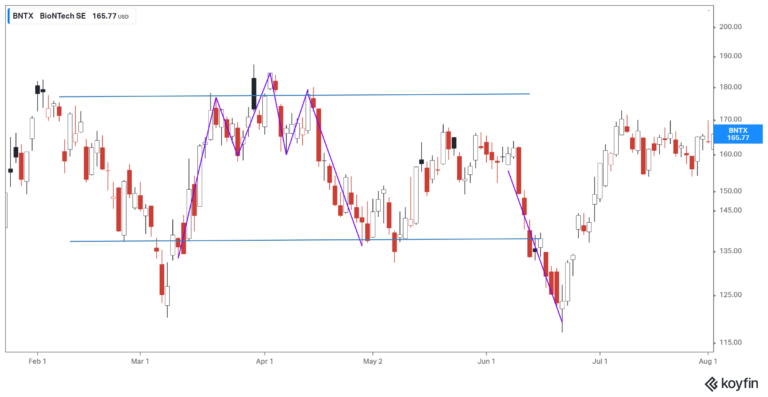
Identify potential resistance levels on the way up, such as previous highs or significant technical levels. Consider taking partial profits or adjusting stop-loss orders at these levels. In our example, if you draw a straight line over the peaks of the many months, you’ll see that the price resistance is around $88.

Whenever the stock reaches around that price, keep watch of any signal and be ready to sell, if you must.

Profit-Taking (short position):

If you’re shorting the stock previously, consider closing that position and start taking profit from that bet.

P/s: Assess the risk-reward ratio before entering the trade. Ensure that the potential reward justifies the risk taken.

Bottom line

  • The Head and Shoulders pattern is a sign that a current trend may be going for a reversal.
  • A Head and Shoulders Top pattern indicates possible reversal from bullish market to bearish.
  • A Head and Shoulders Bottom pattern indicates possible reversal from bearish market to bullish.
  • In trading, always set a limit where you are going to take profit from the stock, set a stop loss limit, and consider resistance level.
  • Assess the risk-reward ratio before entering the trade. Ensure that the potential reward justifies the risk taken.
  • It’s important to note that no trading strategy is foolproof, and risk management is crucial.
  • Traders should adapt their strategies based on market conditions, use proper position sizing, and consider additional technical or fundamental analysis to support their decisions.

The key takeaways/market update is a series by AxeHedge, which serves as an initiative to bring compact and informative In/Visible Talks recaps/takeaways on leading brands and investment events happening around the globe.

Do keep an eye out for our posts by subscribing to our channel and social media.

None of the material above or on our website is to be construed as a solicitation, recommendation or offer to buy or sell any security, financial product or instrument. Investors should carefully consider if the security and/or product is suitable for them in view of their entire investment portfolio. All investing involves risks, including the possible loss of money invested, and past performance does not guarantee future performance.

Written By

BECOME AXEHEDGE INVESTOR TODAY