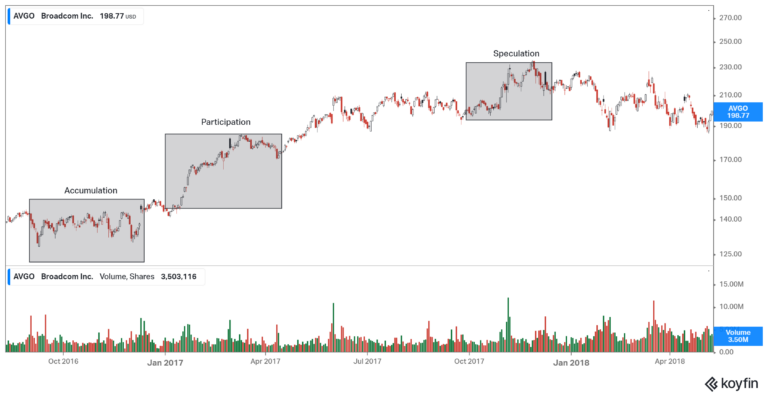
AXEHEDGE

Stock Chart Trading: Dow Theory (Part 2)

How understanding market phases can help you trade better?

Welcome to another series of our trading lessons. This is the second part of our Dow Theory topic, where we’ll look into how traders would usually look into different market phases to make better trade decisions. If you missed the first part of our Dow Theory lesson, check it out below!

Stock Chart Trading: Dow Theory (Part 1)

What do different market phases tell you?

As mentioned in the first part of this series on Dow Theory, the market trend — be it an uptrend or a downtrend — comprises three major phases:

Uptrend — accumulation, participation, and speculation/distribution.

Downtrend — Distribution, participation, and distress selling.

Let’s look at each phase, shall we?

Uptrend

Accumulation


The accumulation phase is a phase that would usually come after a downtrend. At that point, the market sentiment is at its worst, people are desperately selling whatever that they have, driving the price lower and lower.

At some point, the price is too low which makes it a tempting buy, and institutional traders are usually the ones to come and swoop this golden opportunity. Mind you, these are not traders like you and me, they are equipped with the bulk of cash, and they would usually trade in the millions.

This is where most of the shares sold by normal traders who have abandoned hope easily find their match — from the institutional traders buying. That is how the price suddenly stabilizes and forms a resistance level. This is how the accumulation phase is formed.


Participation


The participation phase is when traders smell what’s brewing. When they see that the stock is trading at a very consistent support level, they can somewhat guess there’s a big gun pulling the strings. What does that tell them?

It means that when a big gun is betting on a stock, there is a bright chance for the stock. Mind you, these big guns are well equipped with massive databases, paid charting software, insider information — you name it!

This is when these traders would join in, especially after the release of good news by the company, and the price will rocket at this phase. Mind you, many normal traders are usually left out of this phase because it rises quickly.


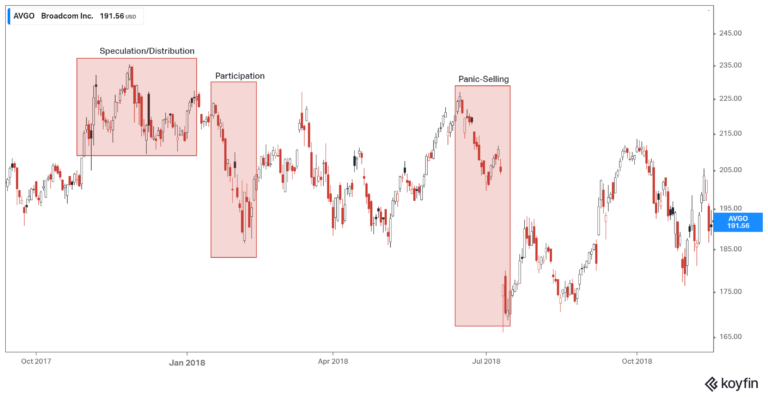
Speculation/Distribution


This is the phase where the price reaches a certain high and everyone is starting to talk about it, it’s all over the news, and this is when many normal traders would usually join in, despite the high risk that this phase bears. This is where the big guns have already slowly dropped whatever they hold for profit.

Simply, it is a point where the stock is just waiting to crumble. This is also why many retail traders lose money because they tend to go for attention-grabbing stocks. Mind you, the point that a stock is usually under the limelight, it’s usually when the rally is about to end.

Downtrend

Distribution


This is the phase where the big guns are selling the shares they bought earlier on. That’s why there’s as if a ceiling on the price (resistance) that whenever it wants to go higher it can’t. The dynamics in this phase is that retail traders would usually buy the stock, causing the price to rise, but the institutional traders will sell it, causing the price to stop rising at a certain point.


Participation


Much like the participation phase in an uptrend, this is when more savvy traders start to see what’s going on and decide it’s time to follow suit. This is when the price will rapidly fall. What about the retail traders? They’d usually got stuck in the trade, where some have already abandoned the ship, but many are still hopeful since they got in late, so selling now would mean massive losses for them. See how after the price drops, it began rising again, only to drop again when panic-selling hits.


Panic selling


This is where all hopes are lost. The retail traders who got stuck trading and stay just so that they don’t lose money start selling. In the graph above, the sentiment is as follows: They bought when the price was about to fall. The price fell and they made a massive loss, and instead of selling, they waited for the price to push up a bit higher. They were hopeful to see if the price could inch higher so that at least they could go off with a tiny profit. It didn’t, the price falls and everyone said “nope” and started selling massively, causing the price to sink like how the Titanic did.

Bottom line

  • The market trend (up/down) moves in three major phases.
  • These phases are part of the concept introduced under the Dow Theory.
  • The beginning phase is usually initiated by institutional traders.
  • Their move would soon be followed by savvy traders.
  • The rest of the traders would then swarm over when the stock is already hot.
  • Understanding the market phases will help you make smarter trades and not just go for what’s hot on the news.
  • Apart from understanding these phases, look into other indicators as well to make wiser decisions.

The key takeaways/market update is a series by AxeHedge, which serves as an initiative to bring compact and informative In/Visible Talks recaps/takeaways on leading brands and investment events happening around the globe.

Do keep an eye out for our posts by subscribing to our channel and social media.

None of the material above or on our website is to be construed as a solicitation, recommendation or offer to buy or sell any security, financial product or instrument. Investors should carefully consider if the security and/or product is suitable for them in view of their entire investment portfolio. All investing involves risks, including the possible loss of money invested, and past performance does not guarantee future performance.

Written By

BECOME AXEHEDGE INVESTOR TODAY