


There are generally three outcomes from observing a trend — reversal, continuation, and consolidation.
Reversal
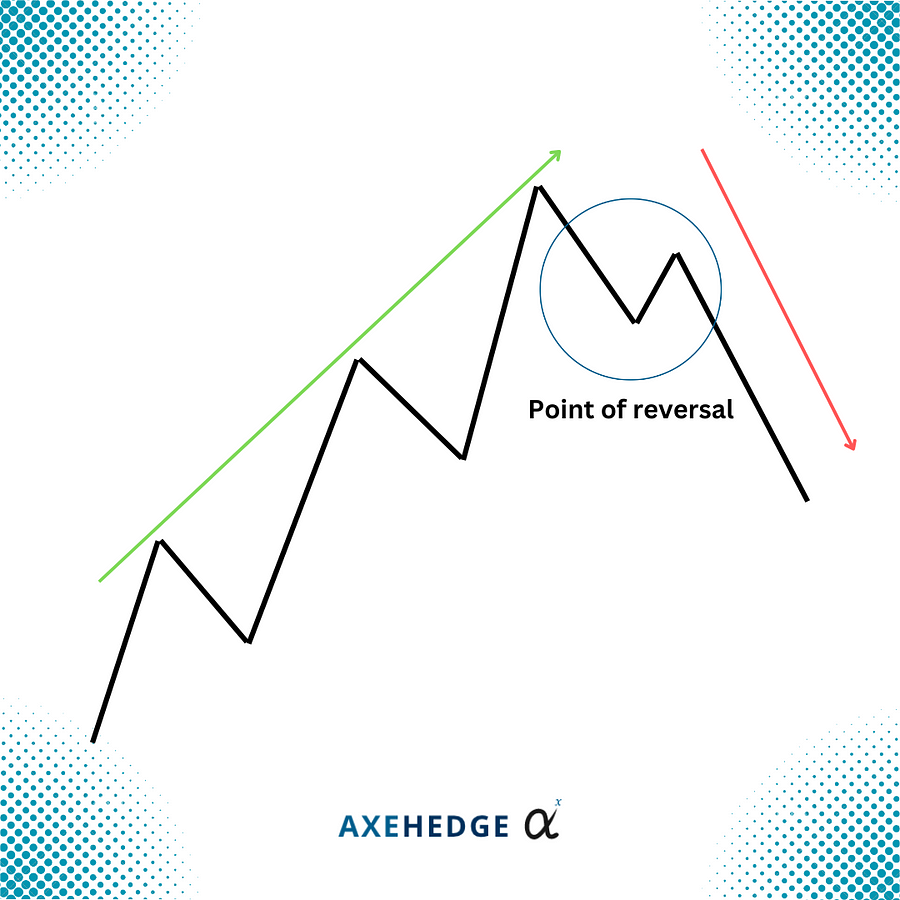
Reversal here refers to a state where a trend moves into a different direction from the previous trend. Say, a Stock price is currently in a downtrend price movement, but the price suddenly went for a reversal, i.e., it is now going up.
Continuation
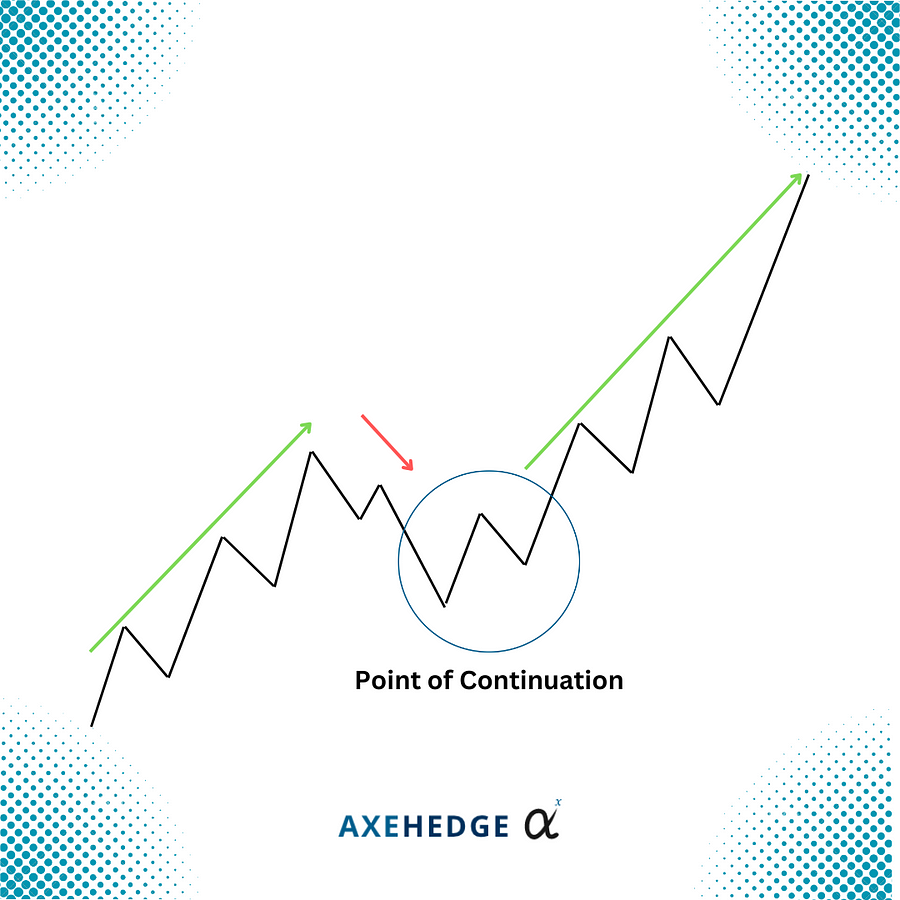
Another outcome that you may get is that you can guess that the price will most probably remain in the same trend as it was — this would usually happen when the price fail to break through its resistance/support level.
Say, Stock ABC is trending upwards, but the upward trend suddenly starts shrinking, and as many are nervously anticipating, the price went down a bit, but not down enough to break through the support level, and it continued rising — this is where traders would sigh in relief and continue with whatever they’re doing.
Consolidation
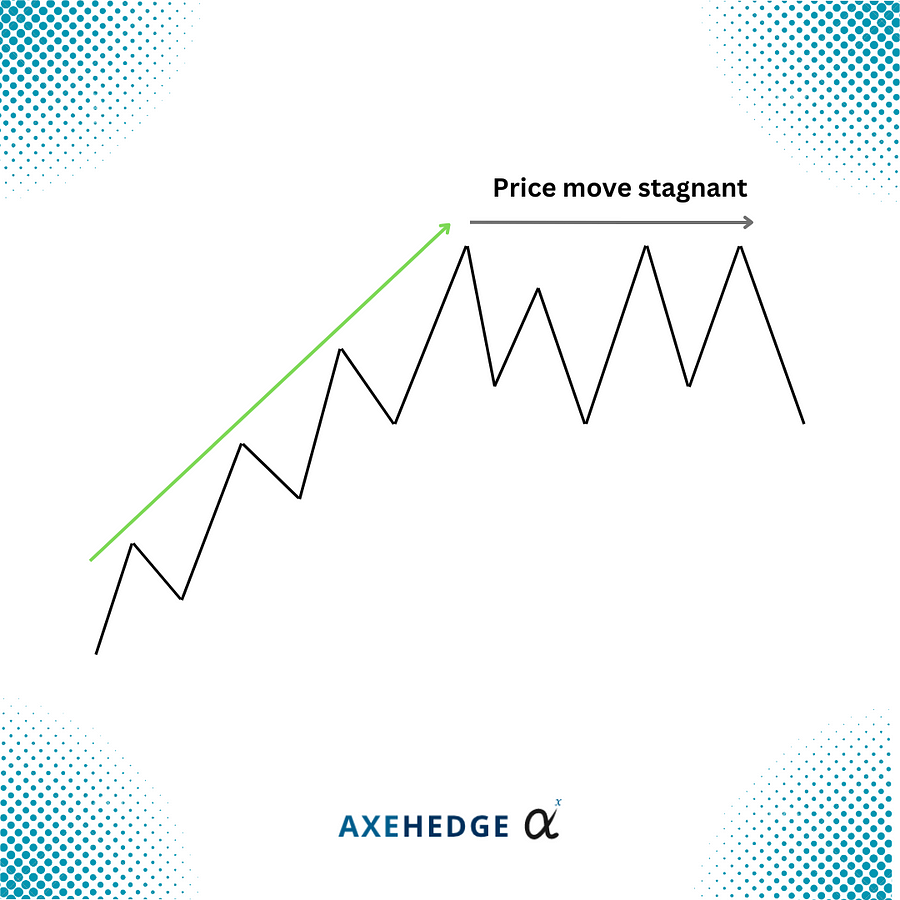
Consolidation is a point where the price moves in a rang that is rather stagnant, unlike the trend that it was in before.

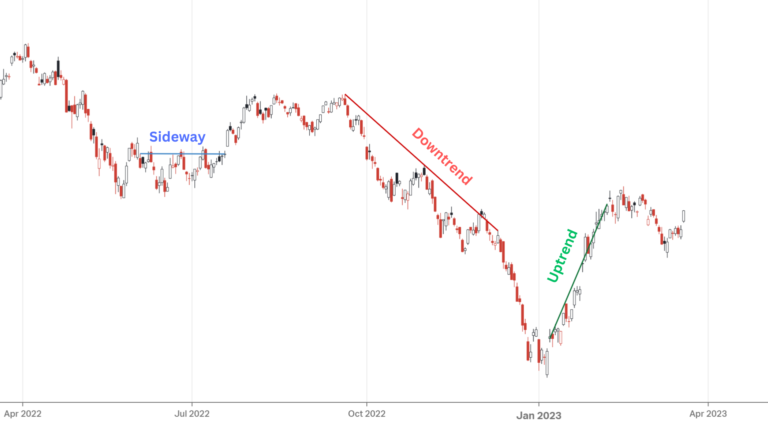
Now, one of the questions that we get the most is: how you consider a trend as an uptrend or a downtrend when within the so-called downtrend itself there are many times when the price moves up, and vice-versa in the upper trend?
That is where the time frame comes into play. You don’t look at every single change of price at every single point in time and call it a trend, that is what many call as madness.
What you can do is set a certain period of time that you want to observe the price movements, and generally, within that period, is the price at the end of the period higher than when it started? If yes, then it is an upper trend. If the price ends lower, then it is a downtrend. If the price is more or less the same as when it started, it’s a sideway trend.
There are generally three time frames that are used by investors and traders:
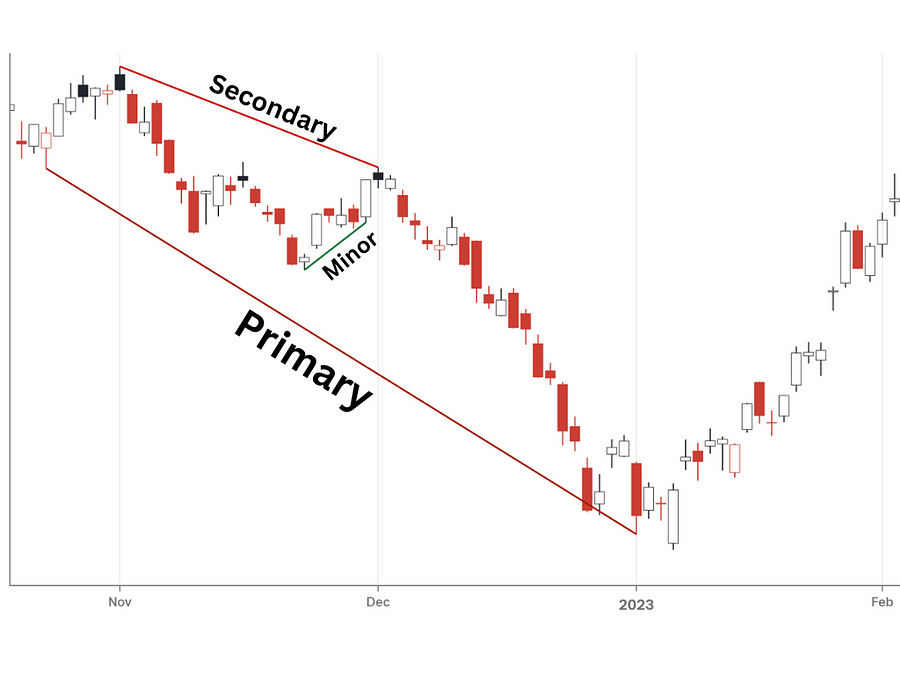
1. Primary Trend
A primary trend refers to a trend that goes on for a long period of time. This trend is useful for investors or traders who are looking at a longer time range for their investments or trades. This is also good for short-term investors to look into the price range that they will either buy or sell their asset.
Why? Let’s take an example if you’re looking to go for a few weeks’ trades, the price may be moving up for the past few weeks, but on a larger scale, you see that the price is moving down on a month-to-month basis.
So, what you’re going to do is look if the weekly price hike has reached a point that is too high — say, it’s moving up to $100 in which, looking at the primary trend, the price will most likely not go beyond $100 since it’s generally falling — so, you might want to sell it at that point.
However, before you start investing using this method, we are bound to tell you that long-term investments are more suitably done via the fundamental analysis method. All of these chart-reading techniques are under the technical analysis method, which is more suitable for short to medium-term.
2. Secondary Trend
A secondary trend is just a fancy name for a medium-term price movement trend. It’s not too long like primary, but not too short like a minor trend. It’s usually used by short-term and medium-term investors.
3. Minor Trend
Minor trends are little price movements over a short course, perhaps a few days or just one week. Generally, it can’t be a good indicator to tell if the company is doing good or not, but it’s generally used by day traders (short-term traders) to make the most out of the price movements. One thing you need to know is that day traders are indifferent to how well is a company doing, all they care about how are the movements looking.

In determining future trends, what traders or investors would do is they will use previous trends in trying to figure out these two things: Support and Resistance.
Tips: Resistance and support level need not be a perfectly horizontal line from left to right of the chart, it can slant upwards or downwards. What’s important is that there are these invisible ‘ceilings’ or ‘floors’ that keep the price from moving beyond that level.
Support
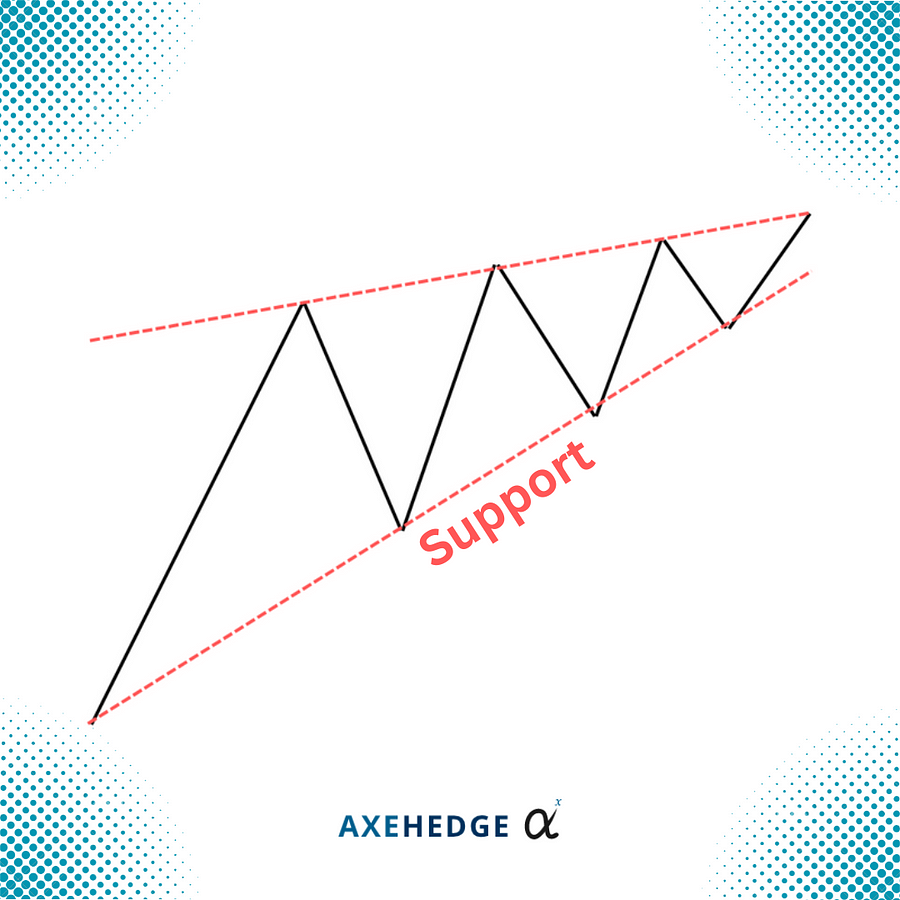
Support here refers to a level in which the strength in the number of people buying the asset is higher than the strength of people who are selling, thus the price doesn’t go below that level of strength.
If the price somewhat goes below the support level, then it means that the trend might be changing for worse, so traders either sell their asset, or start short selling.
However, price movements in real life is a bit different from the graph we show above, sometimes the price did go beyond the support level, but perhaps it is in a very short period of time, or the price level at which it exceeds support level is not as significant, so this is where the challenge usually is — to see if it’s a real change in trend, or just a scare.
Resistance
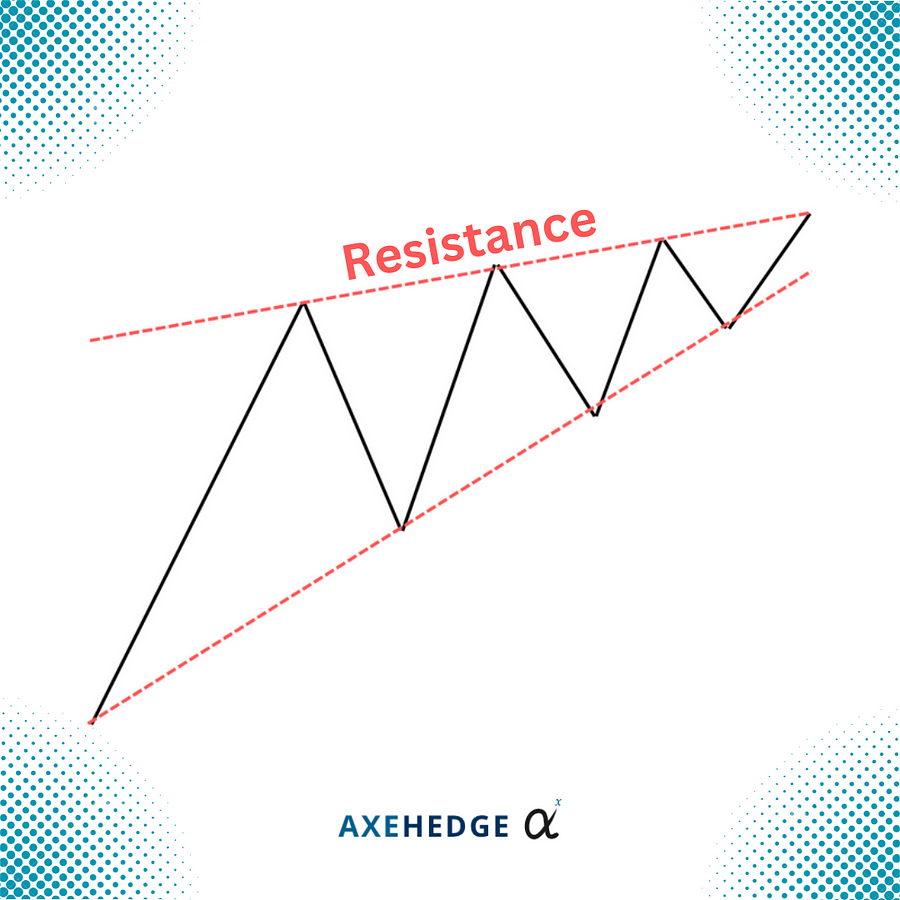
Resistance refers to a price level where the sell sentiment is stronger than the buy sentiment. Simply, it is a particular price level in which people thought it’s the best time to sell, so the price won’t usually go beyond the resistance level.
If it does go beyond that level, traders would usually jump for it immediately since it means that the price will most likely be moving up!
What you need to do?
First, you’ll have to see how strong the support and resistance level is.
If you see that the chart more often than not exceed the support or resistance line, then it means that the support or resistance line isn’t strong enough — or you need to improve on where you draw the lines. So, it’s either you need to identify a better support/resistance level, or you can also decide that the stock isn’t a safe bet and look for something else that you can be more confident with.
Much like life, if you think that people too often cross the line, perhaps you need to look inwards and reevaluate if you’re overdrawing your lines, thus driving people out of your life, or you should just look for different people to be friends with.
Second, you need to evaluate the probability of the price moving up or down.
Once you’ve identified the support and resistance level, you need to evaluate if the movement is strong enough for the price trend to either continue, reverse, or remain the same.


