AXEHEDGE

Stock Chart Pattern: The Gap Pattern

What are the types? What do they look like? All you need to know about it.

Just like we’ve promised in our previous guide “Stock Chart Basics for Beginners”, we are going to explain one particular type of stock chart pattern in detail – the gap pattern.

What does the gap pattern refer to?

A gap pattern refers to a situation where there is a significant price difference of a particular stock at the time when the market reopens compared to when the market closes.

So, when you look at a certain type of chart – like the candlestick chart or the OHLC chart, you can see a gap between the price (just like the one highlighted in the picture above).

Simply put, for example, the stock market closes every day at 4 p.m. Everyone’s going back home just trying to relax – but Company XYZ announce at 5 p.m. that they’re releasing a new product that can make huuuuuuuuge profit.

What happens then is that the traders will then start jumping off their seats to place an order to buy XYZ’s stock so that when the market reopens, they get to have this stock in their pocket. However, when people start placing their orders in droves, the price of the stock will increase significantly.

The same example can be said to be a falling price gap – which usually is preceded by some bad news to the market.

Types of the gap pattern


There are four types of gap patterns that usually occur. They are: common, breakaway, runaway, and exhaustion.

1. Common

A common gap is a type of gap which bears no significance to the prospect of the price. With this type of gap, the price may go up, or down, but the gap itself really doesn’t really indicate much about what may happen in the near future.


How to identify common gaps?

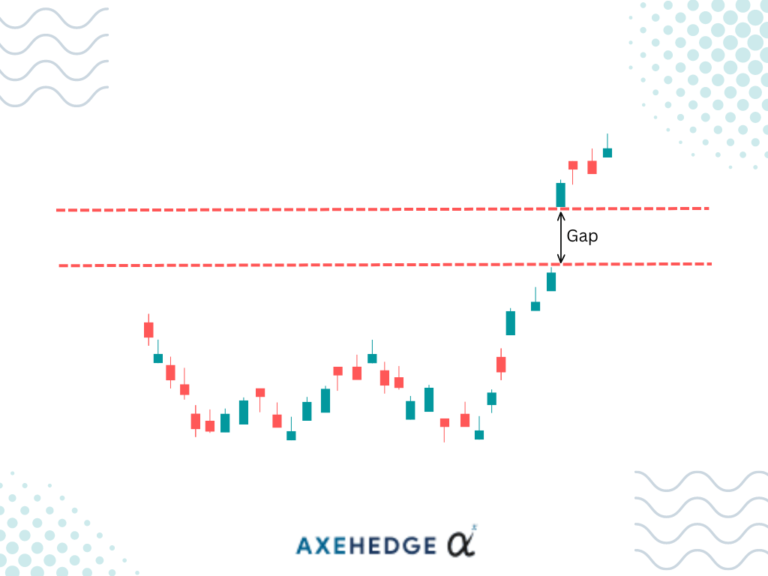
The common gap can deceive traders, especially new ones, but the general understanding is that there’s nothing extraordinary going on. Even if the gap is a bit higher than the previous day, it is due to normal market movements.


The common gap’s price movement is not too remarkable. For example, if the price of XYZ usually moves by $1 from day to day, and suddenly you see a gap with the value of $1. It is most likely that it is a common gap. 


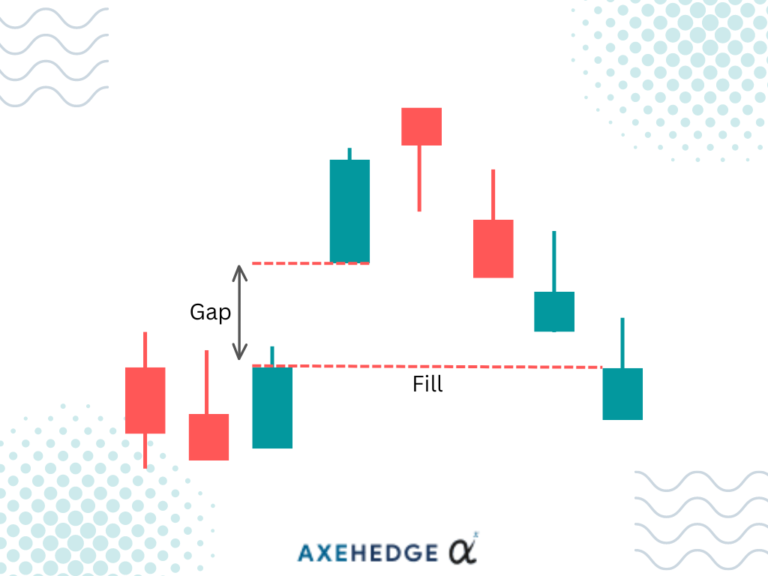
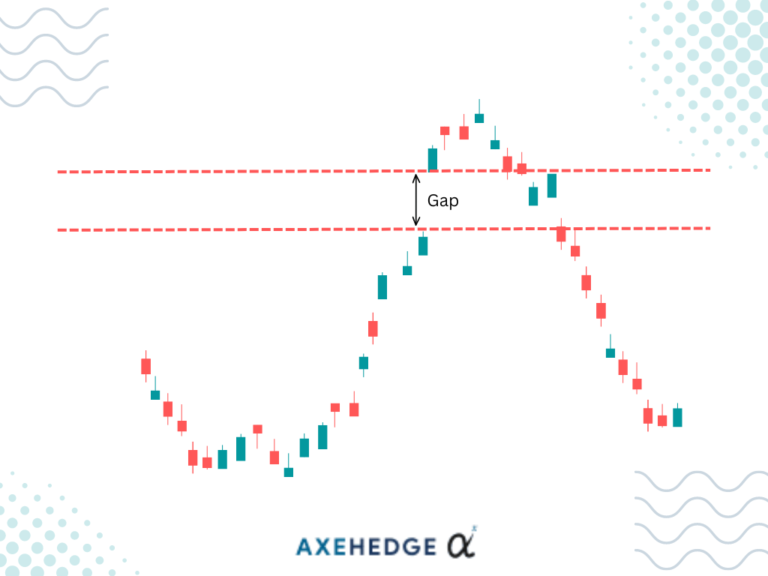
One of the easiest ways to identify a common gap is that the gap will be filled only within a few days of the gap. 


What do we mean we mention “be filled”? How is the gap filled? A gap in the stock chart is considered filled when the price after a few days reaches back to the price on the day before the gap happened – or really close to that price.


For example, Stock XYZ’s closing price on Monday was $3. Suddenly, it opened at $3.5 on Tuesday. However, after a few days, let’s say on Friday, the price goes back down to $3.


Another way to know if it is a common gap or not is when the trading volume* is low. So, if Stock XYZ is usually traded at a volume of 100,000 a day, and then the gap happened but the stock is still traded at around 100,000 for the day, it is very likely that the gap you’re seeing is a common gap. 


In a nutshell, what you need to know is that a common gap means… nothing. Maybe the price will suddenly rocket itself to high heaven after the gap, or it could plunge down to diablo’s lair – but none of this is related or attributed to this gap.


*Trading volume refers to the number of shares or contracts exchanged for the day. Simply, how much of this stock was bought and sold from the time when the market opened until it closes.

2. Breakaway

A breakaway gap indicates that there is a possibility that the price trend is about to move in a different direction. So, if you see that the trend has been going up and suddenly a breakaway gap appears, it could be a sign that it may go down as the price unfolds.

How to identify the breakaway gap?

First, you’ll have to look at the congestion area of the stock – which refers to the usual price that the stock is traded at over a period of time. 


For example, Stock XYZ’s price moves up and down, but it usually hovers at around $10. Then, what you need to do is draw a line at $10. This line is your breakaway line, or as we love to call it – the breaking point.


After having jotted the line, a breakaway gap would usually happen when the gap moves beyond the line, like in the picture above.


Another sign that a breakaway is happening is when you see the trading volume spikes, be it before or after the gap. This is usually due to people becoming interested in the stock.


This situation usually happens when there’s either a really good or bad report regarding a company, like the CEO screwed up big time or they struck gold or something.

3. Runaway

The Runaway gap is also known as the continuation gap, which indicates that the current trend may continue its way. So, if the stock trend is going down, upon seeing a runaway gap, it is likely that it will continue moving down – and vice-versa. 


In an example where the price is going up again after a long period of fall, some people didn’t get to jump in the cash grab. Runaway gap basically shows you that the price continues to rise because these people who missed the chance are now rallying to join in.


The Runaway gap also tells you (in some cases) that the trend has nearly reached its maturity, and traders should be prudent to look at the signs if the price is going to reverse. 

How to identify the runaway gap?

First, a runaway gap usually follows the previous trend. So, if the stock is rising, the gap would be an upward gap. If the stock is going down, the gap would go downwards.


Another sign that a runaway gap is happening is that there is no short-term filling, unlike a common gap. We have defined what “filling” refers to, but here it goes again (we hate scrolling back up there so we know you do too): 


A gap in the stock chart is considered filled when the price after a few days reaches back to the price on the day before the gap happened – or really close to that price.


One major sign of a runaway gap is that the trading volume usually increases before, during, or after the gap – which portrays a lot of people being hyped up to join the bandwagon. 


BUT don’t confuse the volume with the exhaustion gap – a runaway gap would usually see a high trade volume, but not as superbly high as it is during an exhaustion gap. Another thing you have to take note of is that it’s hard to predict which is which until a few days after the gap.

4. Exhaustion

An exhaustion gap is a type of gap you’d usually see at the end of a trend. When there is an exhaustion gap in the chart, traders would usually prepare themselves for any change in the trend. 


For example, if the stock trend is currently going up, an exhaustion gap that appears may indicate that perhaps it’s time for it to go down again.


Simply, you can say that it Is almost as if the chart is so tired of its current trend and wants to try something new.

How to identify the exhaustion gap?

First, an exhaustion gap usually would appear after a trend has set off, as a sign that the trend may end soon. So you would usually find it after the trend has been there for a certain period. 


How long would that usually be? That’s a question we don’t have an exact answer to, as it would depend on each situation. Some trends last a week, some a month, and some perhaps more. 


Another thing that you can see from an exhaustion gap is that the trading volume will be extremely high – this is because as an exhaustion gap unfolds, traders would go into a frenzy of panic buying or selling. 


What differentiates exhaustion from breakaway, isn’t an end to a trend the beginning of another?


Well, philosophically yes… but in this context, one major difference you can see is that the exhaustion gap is usually filled in again after a few days, whereas the breakaway gap isn’t.


In a situation where the current trend is up, an exhaustion gap usually would appear as if it is going upwards but then it would fall to the pre-gap price and continue falling. In a breakaway situation, usually, the gap is already heading south and continues to do so.

Key takeaways:

  • There are four types of gap patterns: common, breakaway, runaway (or continuation), and exhaustion.
  • The common gap tells you nothing significant. It’s just another day another price movement.
  • A breakaway gap is a sign that a new trend may be approaching.
  • The Runaway gap is just a continuation of the ongoing trend.
  • An exhaustion gap occurs when the trend is showing signs that it is about to die off.
  • Keep yourself aware of the trading volume when trying to watch for these trends.

The key-takeaways/market update is a series by AxeHedge, which serves as an initiative to bring compact and informative In/Visible Talks recaps/takeaways on leading brands and investment events happening around the globe.

Do keep an eye out for our posts by subscribing to our channel and social media.

None of the material above or on our website is to be construed as a solicitation, recommendation or offer to buy or sell any security, financial product or instrument. Investors should carefully consider if the security and/or product is suitable for them in view of their entire investment portfolio. All investing involves risks, including the possible loss of money invested, and past performance does not guarantee future performance


Written By

Become a AXEHEDGE investor today.