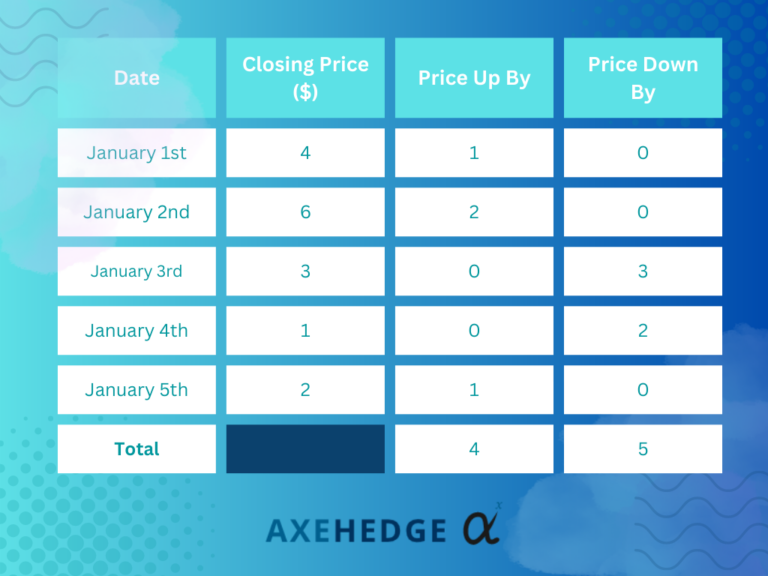
How it’s calculated is, you look at the price movements each day, for example, the price on January 2nd rose by $2 right? So, you mark it — January 2nd, price is up by $2. Now, take January 3rd, when the price fell by $3 from $6 to $3, you mark it — on January 3rd, the price falls by $3.
Mind you, there is no negative value, so if the price fell for that day — say, by $1, what you’ll have to do is write in the “price down” section the number “1”, but since the price for the day fell, it means that if anyone asks you “how much the price rose today?” The answer is none, right? Because the price didn’t rise. So how much is “none”? — yep, 0, now write that 0 on the “price up” section.
Why is this important? To calculate the Average Gain and Average Loss!
Back to the calculation.
Average Gain = Total gain in the period / Period number (days/weeks/months, etc.)
Average Loss = Total loss in the period / Period number (days/weeks/months, etc.)
Now from the table above, here is how the calculation will look like:
Average Gain = 4 / 5
Average Gain = 0.8
Average Loss = 5/5
Average Loss = 1
RS = Average Gain / Average Loss
Thus,
RS = 0.8 / 1
RS = 0.8
Back to calculating the RSI,
RSI = 100 — [ 100 / (1 + RS)]
RSI = 100 — [ 100 / (1 + 0.8)]
RSI = 44.44
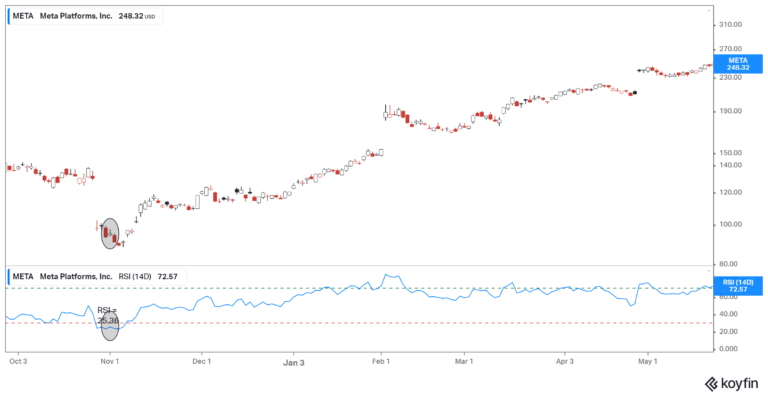
Based on the scale, we can tell that the stock’s selling sentiment is stronger because it’s closer to the 30 range, but it’s not yet up to the point that it’s sold too much, and a reversal might happen.
Here’s how it will look if you look for RSI in a charting software app. See the blue line at the bottom? That is the RSI value of the stock (in this case we use 14-day RSI). The green dotted line tells you when the RSI reaches the point of being overbought and the red dotted line tells you when it reaches the point of being oversold.