AXEHEDGE

Stock Chart Indicator: Fibonacci Retracement

How do traders use Fibonacci Retracement to trade?

In the realm of technical analysis, traders often employ various tools and indicators to gain insights into the price movements of financial instruments. One such tool that has gained significant popularity is Fibonacci retracement. Derived from the famous Fibonacci sequence, this technique allows market participants to identify potential support and resistance levels, aiding in making more informed trading decisions.

In this article, we will delve into the concept of Fibonacci retracement, its application, and its significance in modern financial markets.

Table of Contents

How does the Fibonacci sequence work?

The 23.6%, 38.2%, 50%, 61.8%, and 78.6% came from the result if you divide the numbers within the sequence in a certain way. For example, 61.8% is achieved when you divide most numbers in the sequence with the immediate number after it.

E.g.:

233 in the Fibonacci sequence is when 89 + 144.

Now, see 144/233, the answer is 0.618.

The same result would appear if you divide 89 by the number after it, which is 144.

There are two main rationales for why traders often use the Fibonacci sequence:


The pattern appears a lot in nature


The proportion involved in the Fibonacci sequence appears a lot in nature — facial constructs, floral patterns, galaxies, and more. Many beautiful paintings or photographs are attributed to their adherence to the Fibonacci pattern. Take a look at Michelangelo’s ‘Creation of Adam’ below.

“But paintings are human-made?”

Yes, now take a look at the structure of the seashell below.

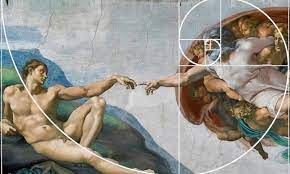
Things can appear to not be in adherence to the sequence, but in most cases, when they follow the sequence, they tend to be beautiful to the human mind. The reason behind it is that it’s mathematically accurate.

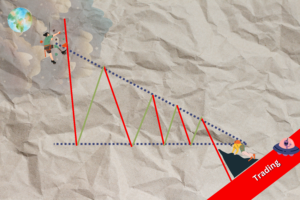
From that theory, traders derive a conclusion that price movements tend to follow the same ‘law of nature’.

Isn’t that comparing apples to… say, pears?”

In some ways, you can say that there might not be an actual reason as to why it should work, but below is another point.


Many people are using it


It sounds weird, like, the only reason that it works is because many people are using it — but that’s the truth. After all, trading is about playing with market sentiments.

Here’s a scenario to make it make sense: you live in a community, and within the community, everyone somewhat thinks that whenever they see a yellow pelican flying overhead, it means that the place will run out of water. One day, they see a yellow pelican flying, and you somewhat have a few tanks of water stored.

If you take advantage of the panic and sell the water you have stored, you could make a lot of money! So, even if there’s no actual correlation between a bird and the water running out, one thing that correlates is that people would panic when the ‘signs’ appear.

In the same way, if everyone in the market thinks that the price is going to move in a certain way once it touches a certain pattern, they will act that way, Make-believe, I’d say, but if it works, it works.

How to apply Fibonacci Retracement in your trading decisions

Fibonacci Retracement consists of a few lines drawn based on the price movements of a financial instrument. The line is measured on the percentage, which is around 23%, 38%, 61%, and so on — simply, by applying the Fibonacci law to draft the line.

Do you have to calculate it? No. Most charting software nowadays (including free ones) have the Fibonacci retracement function. All you need to do is click on the function when you’re looking at your graph. Find the peak or the low point in the graph, then drag the line from the bottom to the peak (or peak to bottom) — then the software will do the line drawing for you.

So, how does it help you with your trades?

The Fibonacci Retracement is usually used during an uptrend or a downtrend. What it tells you is that when the price is moving up, it will likely ‘take a little break’ and go down to one of the lines before continuing its uptrend, and if it’s in a downtrend, it may move up for a while before going down again.

Simply, it creates a support and resistance level for you when you trade.

From this, you can tell if you should hold on to your position or close it. We’ll look at both situations –


Uptrend


This is when you buy the stock at the bottom of the line, and it moves on an uptrend. Suddenly, the price falls. Should you keep it, or should you hold on to it? Many traders will see if it’s a normal retracement or if the trend is actually failing. To do this, they’ll use the Fibonacci lines as a reference.

See from the graph above how the price moves up and down, but a small change of pace happens when the price touches the line (we circled these moments). Through this, you can tell when to sell, hold, or even buy.

Some who are late to the trend will also use this to place their buy, despite making a smaller profit, but a penny earned is a penny earned, right? Many also wait to see if the trend peaked so that they can get ready for the reversal (take profit or short-sell).


Downtrend


This is usually for traders who are short-selling. When you bet against the market, it’s important to see if the downtrend is going to last or if it’s going to shift the other way around.

See how the price would shift its movements when it touches the line? In most cases, many will close their positions once the price nears the bottom-most line.

Some will also place their buy, sell, or short-sell based on the movements along these lines. They may make a smaller profit since they’re late to the party, but any profit is better than none. Many also wait to see if the trend peaked so that they can get ready for the reversal (buy or take profit from short-selling)

Arguments against Fibonacci Retracement

The usual argument against Fibonacci Retracement is that it’s a fallacious belief, and the fact that Fibonacci lines deeper into the trend tends to be of smaller margins from one to another, any opposite price movements are mistakenly believed to be a sign that the Fibonacci retracement works.

So here are the two key arguments — first, the lines are smaller near the top of the uptrend (or bottom of a downtrend) so any shift might easily touch these lines, without the lines actually having anything to do with it.

Second, the smaller lines are placed near the top of an uptrend or the bottom of a downtrend, which means that by that time, there is a high likelihood that the trend is already losing steam anyway.

Personally, however, despite agreeing with the arguments above, I am of the belief that Fibonacci retracement is usable because it is subscribed to by many, and the whole point of trading is to make use of the sentiments of many. Although, it may be more useful when dealing with stocks compared to forex, as stocks are less volatile, and there are not as many moving factors that can affect the price.

Bottom line

  • Fibonacci Retracement is a tool derived from the mathematical concept of the Fibonacci sequence.
  • The method is used by many as it usually works, and it usually works because it is used by many.
  • It is usually used to see if the price will retrace during an uptrend or downtrend.
  • It can indicate a good place to buy, sell, hold, or even short-sell.
  • The indicator works better with stocks than it does with forex.
  • Be sure to look at other indicators as well to support your hypothesis.

The key takeaways/market update is a series by AxeHedge, which serves as an initiative to bring compact and informative In/Visible Talks recaps/takeaways on leading brands and investment events happening around the globe.

Do keep an eye out for our posts by subscribing to our channel and social media.

None of the material above or on our website is to be construed as a solicitation, recommendation or offer to buy or sell any security, financial product or instrument. Investors should carefully consider if the security and/or product is suitable for them in view of their entire investment portfolio. All investing involves risks, including the possible loss of money invested, and past performance does not guarantee future performance.

Written By

BECOME AXEHEDGE INVESTOR TODAY