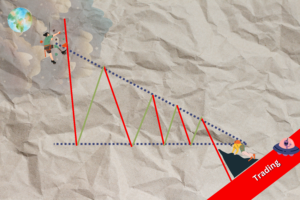
The second triangle: the Descending Triangle
Read More
Stochastics in Trading
Stochastics are used to show when a stock has moved into an overbought or oversold position.

Table of Contents
Definition
Stochastics indicators are technical analysis tools that measure the momentum of a stock or other financial instrument. These indicators are based on the principle that as a stock’s price increases, its momentum will also increase until it reaches a point of saturation, after which it will begin to decline. Similarly, as a stock’s price decreases, its momentum will also decrease until it reaches a point of saturation, after which it will begin to increase.
In simple terms, stochastic indicators measure the relationship between a stock’s closing price and its price range over a specified period of time. This is done by comparing the current price of a stock to its highest and lowest price over a given time period, usually 14 days.
What Are Stochastics in Technical Analysis?
In technical analysis, stochastics refers to a group of oscillator indicators that point to buying or selling opportunities based on momentum. In statistics, the word stochastic refers to something that is subject to a probability distribution, such as a random variable.
In trading, the use of this term is meant to indicate that the current price of a security can be related to a range of possible outcomes, or relative to its price range over some time period.
The closing price tends to close near the high in an uptrend and near the low in a downtrend. If the closing price then slips away from the high or the low, then momentum is slowing. Stochastics are most effective in broad trading ranges or slow-moving trends.
Type of stochastic indicators
There are several different types of stochastic indicators that can be used in stock trading, including the Stochastic Oscillator and the Relative Strength Index (RSI). These indicators can be used on their own or in conjunction with other technical analysis tools to confirm trends and make informed trading decisions.
Stochastic Oscillator
It is the most widely used stochastic indicator. It measures the relationship between a stock’s closing price and its price range over a specified period of time, usually 14 days. The Stochastic Oscillator is expressed as a percentage, with values ranging from 0% to 100%. A value above 80% indicates that a stock is overbought, while a value below 20% indicates that it is oversold. These values can be used to identify potential buying or selling opportunities, as overbought and oversold conditions are often followed by a reversal in stock prices.
Relative Strength Index (RSI)
The RSI is another widely used stochastics indicator. It measures the strength of a stock’s price action over a specified period of time, usually 14 days. The RSI is expressed as a percentage, with values ranging from 0% to 100%. A value above 70% indicates that a stock is overbought, while a value below 30% indicates that it is oversold. Traders use the RSI to identify potential buying or selling opportunities, as overbought and oversold conditions are often followed by a reversal in stock prices.
Williams %R
It measures the relationship between a stock’s closing price and its price range over a specified period of time, usually 14 days. The Williams %R is expressed as a percentage, with values ranging from -100% to 0%. A value above -20% indicates that a stock is overbought, while a value below -80% indicates that it is oversold. Traders use the Williams %R to identify potential buying or selling opportunities, as overbought and oversold conditions are often followed by a reversal in stock prices.
Fourteen is the mathematical number most often used in the time mode. Depending on the technician’s goal, it can represent days, weeks, or months. The chartist may want to examine of the entire sector. For a long-term view of a sector, the chartist would start by looking at 14 months of the entire industry’s trading range.
Stochastics in stock trading
Stochastics had always been a good indicator tool in stock trading as they can be used to identify overbought and oversold conditions, potential trend reversals and to make a profitable trading decision.
First of all, stochastic indicators can help traders identify overbought and oversold conditions. Next, it also can help to identify the potential trend reversal by analyzing divergences between stock prices and the indicator.
For example, if a stock is trending higher but the stochastics indicator is trending lower, it may indicate that the uptrend is losing momentum and a downtrend may be starting. Conversely, if a stock is trending lower but the stochastics indicator is trending higher, it may indicate that the downtrend is losing momentum and an uptrend may be starting.
Last but not least, stochastics can be used as a tool in conjunction with other technical analysis tools to confirm trends and make informed trading decisions. For instance, if a stock’s stochastic indicator identifies it as an overbought stock but a resistance level is approaching. This gives a signal to the trader that you might consider selling the stocks and vice versa.
In stock trading, stochastics have some limitations, namely that it triggers false signals, which should be supplemented by other indicators and analysis techniques before making any trades. Plus, it also is a lagging indicator, which means the reaction towards price movements rather than predicting them. This makes it difficult for trades to enter at the most ideal time.
So, how is the indicator work
Generally, the area above 80 indicates an overbought region, while the area below 20 is considered an oversold region. A sell signal is given when the oscillator is above the 80 level and then crosses back below 80. Conversely, a buy signal is given when the oscillator is below 20 and then crosses back above 20. 80 and 20 are the most common levels used but can be adjusted as needed.
Overbought or oversold regions create crossover signals. In the overbought region, a decreasing %K line crosses below the %D line indicating a sell signal. On the other hand, a buy signal occurs when an increasing %K line crosses above the %D line in an oversold area.
Stochastics in Risk Management and Profit Maximization
The use of stochastic indicators in the stock market can be very beneficial for reducing risk and maximizing profits.
The stochastic indicator can help traders set stop-loss orders when the market is overbought or oversold by identifying overbought or oversold conditions. For instance, if a stock is overbought with a stochastic indicator above 80%, a trader might set a stop-loss order below the current price to protect against potential losses.
Trading strategies can be based on stochastics, in which traders use stochastics to identify when a stock is oversold and use that as an entry point. Similarly, it can reverse the process for overbought stocks and use that as an exit point.
The stochastics can be used as a trend-following indicator, which allows traders to adjust their positions as the stock moves up or down. A trader may buy a stock during an uptrend and hold it until the stochastics indicator indicates that the uptrend is losing momentum.
Stochastics can be limited in some circumstances, depending on the conditions of the market.
Stochastics may not be effective in highly volatile markets. During these periods, stochastics may produce false signals and may not accurately reflect the true direction of the stock. It’s especially true in sudden news events such as earnings releases or unexpected economic data releases can cause sudden price movements in a stock. Stochastics may not be able to keep up with these sudden movements. Furthermore, it may be unable to perform efficiently in low liquidity markets, which might reduce the accuracy of the stock’s actual direction.
Bottom Line
Stochastic indicators are useful tools in stock trading, but traders should be aware of their limitations when dealing with certain market conditions where stochastic indicators can be useful.
The key takeaways/market update is a series by AxeHedge, which serves as an initiative to bring compact and informative In/Visible Talks recaps/takeaways on leading brands and investment events happening around the globe.
Do keep an eye out for our posts by subscribing to our channel and social media.
None of the material above or on our website is to be construed as a solicitation, recommendation or offer to buy or sell any security, financial product or instrument. Investors should carefully consider if the security and/or product is suitable for them in view of their entire investment portfolio. All investing involves risks, including the possible loss of money invested, and past performance does not guarantee future performance.
Trading Dow Pattern the Triangle Pattern (Part 1)
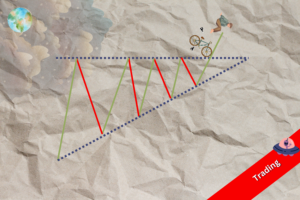
The first triangle: the Ascending Triangle
Read MoreFunds: Equity Funds (Part 3)
How to choose between equity funds based on companies’ earnings...
Read More


