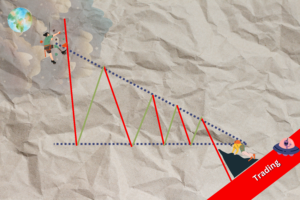
The second triangle: the Descending Triangle
Read More
Elliot Wave Theory – Market Trend Identifier

The Elliott Wave Theory is a form of technical analysis that looks for recurrent long-term price patterns related to persistent changes in investor sentiment and psychology.
Table of Contents
Definition
The Elliott Wave Theory is a method of technical analysis involving the identification of recurrent long-term price patterns based on persistent changes in investor sentiment and psychology. It is used to identify trends and potential price reversals in financial markets, including stocks, currencies, and commodities.
Elliott Wave Theory is based on the idea that market movements follow a pattern of five waves in the direction of the primary trend, followed by three corrective waves against it. These waves are identified and Fibonacci retracements are calculated.
History of Elliott Wave Theory – its origins and evolution over time.
The theory is named after Ralph Nelson Elliott, who developed it in the 1930s after studying market patterns over several decades. He first presented his ideas in the book “The Wave Principle” in 1938.
Elliott believed that market movements were not random but rather followed a predictable pattern of the collective psychology of market participants.. Elliott spent several decades studying the movement of the stock market and discovered that the price action of an asset tended to move in a series of repeating patterns or waves. The Elliott Wave Theory gained popularity in the 1970s and 1980s, as traders and investors began to use it as a tool to predict market movements.
During this time, several books were written on the subject, and Elliott Wave analysis became a popular form of technical analysis. Since then, the theory has continued to evolve, with new techniques and tools being developed to improve the accuracy of wave analysis. Today, Elliott Wave analysis is widely used by traders and investors around the world, and it is considered to be one of the most effective tools for predicting market movements.
Elliot’s 5 Wave Pattern
The Five Wave Pattern is one of Elliott Wave Theory’s fundamental concepts. The theory proposes that market movements follow a pattern of five waves in the direction of the primary trend. These waves are followed by three corrective waves against the trend. It also known as impulse wave, which net travels in the same direction as the larger trend.
Wave 1: This is the first wave of the pattern, which is the initial stage of a new trend. It is typically characterized by a sharp move in price as buyers enter the market, and is often accompanied by high trading volume.
Wave 2: After the first wave, the price typically retraces some of the gains in wave 1. This is the second wave, which is a corrective wave against the trend. It is usually less steep than wave 1, and trading volume tends to be lower.
Wave 3: Wave 3 is usually the longest and strongest wave of the pattern, and it is characterized by a strong move in the direction of the trend. This wave often sees the largest trading volume, and it is typically the wave that generates the most profits for traders.
Wave 4: After the strong move in wave 3, the price typically retraces some of the gains in a corrective wave. This is the fourth wave, which is a corrective wave against the trend. It is often a shallow retracement and tends to have lower trading volume.
Wave 5: The final wave of the pattern is wave 5, which is the last stage of the trend. It is often characterized by a final burst of buying or selling, which can result in a blow-off top or bottom. The trading volume in wave 5 is typically lower than in wave 3. This is the first wave of the pattern, which is the initial stage of a new trend. It is typically characterized by a sharp move in price as buyers enter the market, and is often accompanied by high trading volume.
"What Goes Up, Must Come Down"
Three Collective Wave Pattern
The three corrective wave patterns against the trend is another fundamental concept of Elliott Wave Theory. After the completion of the five-wave pattern in the direction of the trend, the price typically retraces in a corrective pattern against the trend. This corrective pattern consists of three waves, labeled A, B, and C. On the other hand, the corrective wave travels in the opposite direction of the main trend.
Wave A: Wave A is the first wave of the corrective pattern and moves against the direction of the trend. It is typically characterized by a sharp move in price, as traders who missed the initial move attempt to enter the market. The volume in wave A is usually higher than in waves B and C.
Wave B: After the sharp move in wave A, the price typically retraces some of the gains in a corrective wave. This is wave B, which moves in the direction of the trend but is still a correction. It is typically a shallow retracement, and the volume in wave B is lower than in wave A.
Wave C: The final wave of the corrective pattern is wave C, which moves against the direction of the trend and is typically the strongest wave of the three. It often sees a strong move in price, as traders who missed the initial move attempt to exit the market. The volume in wave C is usually higher than in wave B.
Five waves move in the direction of the main trend, followed by three waves in a correction (totaling a 5-3 move). This 5-3 move then becomes two subdivisions of the next higher wave move. After the completion of the three-wave corrective pattern, the price may resume its trend in the original direction, or it may reverse direction and begin a new trend.
Fibonacci Ratio
Fibonacci ratios are a key component of Elliott Wave Theory, and they are used to identify potential turning points. The theory proposes that market movements follow a pattern of waves, and each wave is composed of smaller waves that are related to each other through Fibonacci ratios.
In Elliott Wave Theory, the most commonly used Fibonacci ratios are 0.618, 0.382, 1.618, and 2.618. These ratios are used to identify potential turning points in the market and determine the price targets of waves.
Here are some examples of how Fibonacci ratios can be used in Elliott Wave Theory:
Retracement Levels: When a wave retraces in a corrective pattern against the trend, traders often use Fibonacci retracement levels to identify potential support or resistance levels. These levels are derived from the Fibonacci ratios, and the most commonly used retracement levels are 38.2%, 50%, and 61.8%.
In a simpler form, Fibonacci retracements in Elliot Waves can be defined as market corrections that are expected to end at areas of support and resistance that are denoted by key Fibonacci levels of the market. Later on, it was predicted that the market would turn around and resume the trend back in a primary direction.
Price Targets: Traders can also use Fibonacci ratios to determine the price targets of waves. For example, if a wave moves in the direction of the trend, traders can project the length of wave 1 and multiply it by Fibonacci ratios to determine the price targets of wave 3 and wave 5.
Extensions: Fibonacci extension refers to the market moving with the primary trend into an area of support and resistance at the key Fibonacci level where target profit is measured. It is usually used by traders to determine their target profit.
In some cases, waves can extend beyond the Fibonacci ratios. In these situations, traders can use extensions to determine the potential price targets of the extended wave. The most commonly used extensions are 1.618 and 2.618.
Overall, Fibonacci ratios can be used to identify potential turning points in the market, determine price targets, and manage risk.
Pros and Cons of Using Elliot Wave
Advantages of Using Elliott Wave Theory
Trading in the Elliott Wave Theory can provide traders with a framework for predicting future market movements. In addition, Elliott Wave Theory applies flexibility to any financial market, including stocks, bonds, currencies, and commodities. For managing risk and securing profits, traders can use Elliott Wave Theory to identify potential support and resistance levels.
By predicting the potential entry and exit points of a trade based on the wave pattern patterns, the Elliott Wave Theory can assist traders in timing their trades.
Disadvantages of Using Elliott Wave Theory
There is a degree of subjectivity involved in Elliott Wave Theory, since patterns can be subjectively interpreted. It is possible that different analysts have differing opinions about wave counts and patterns. Plus, Elliott Wave Theory can be complex and difficult to learn for new traders. It requires a deep understanding of wave patterns and Fibonacci ratios. Not only that, any technical analysis tool, including Elliott Wave Theory, is capable of producing false signals. Traders should make sure their analysis is supported by other technical indicators or fundamental analysis.
There is no doubt that Elliott Wave Theory is most effective in analyzing medium to long-term market trends. There may not be a good fit for short-term traders or day traders who are seeking quick profits.
Bottom Line
In the field of technical analysis, Elliott Wave Theory is one of the most popular tools that traders use to identify patterns and predict the future direction of the market. The Fibonacci sequence helps identify potential market turning points based on the concept of waves.
There are a lot of advantages to the Elliott Wave Theory, including its predictive power, flexibility, risk management capabilities, and trade timing. Despite its benefits, it also has some drawbacks, including subjectivity, complexity, and the potential for false signals.
The key takeaways/market update is a series by AxeHedge, which serves as an initiative to bring compact and informative In/Visible Talks recaps/takeaways on leading brands and investment events happening around the globe.
Do keep an eye out for our posts by subscribing to our channel and social media.
None of the material above or on our website is to be construed as a solicitation, recommendation or offer to buy or sell any security, financial product or instrument. Investors should carefully consider if the security and/or product is suitable for them in view of their entire investment portfolio. All investing involves risks, including the possible loss of money invested, and past performance does not guarantee future performance.
Trading Dow Pattern the Triangle Pattern (Part 1)
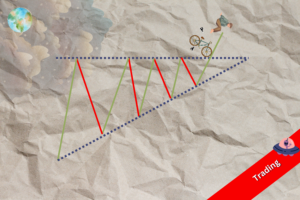
The first triangle: the Ascending Triangle
Read MoreFunds: Equity Funds (Part 3)
How to choose between equity funds based on companies’ earnings...
Read More


