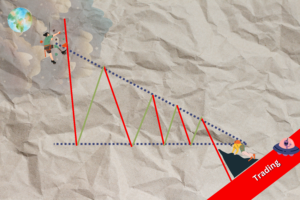
The second triangle: the Descending Triangle
Read MoreA to Z of Stock Trading Volume

Stock trading volume is a crucial metric that provides valuable insights into market dynamics and investor sentiment. Financial markets’ multifaceted role in trading volume.
Trading volume, often overlooked by novice investors, is a fundamental indicator that can offer a deeper understanding of market behavior. Stock trading volume can provide an indication of whether investors are generally bullish or bearish on a particular stock. It can also provide an indication of the overall sentiment of the market. Additionally, trading volume can help to indicate which stocks may be overvalued or undervalued.
Definition of Trading Volume
Stock trading volume is the total number of shares of a particular stock traded on a given day. It is typically expressed as a numerical value, with higher numbers indicating greater activity in the stock market for the particular stock.
The primary purpose of trading volume is to confirm existing price trends. During an uptrend, an increase in trading volume validates the strength of the trend, whereas a decline in volume during a downtrend indicates a weakening trend.
Trade Breakouts
High trading volume indicates the emergence of new trends or validates breakouts from consolidation patterns. Conversely, declining volume near key resistance or support levels can hint at potential trend reversals.
Breakout reversals of stocks can be defined as follows: A reversal breakout forms when down-trending prices sharply reverse and spike higher on heavy volume. This occurs due to frantic short-covering and bargain shoppers flooding into the stock. The massive heavy volume reflects the violent nature of the reversal. It is often caused by breaking news or rumors.
Breakouts are usually defined as price breaking through a support or resistance zone in a continuation move of the prior trend direction as price makes new highs or lows while reversal trades are usually pullbacks in price with traders catching “the turn”, or the point where the pullback ends and price resumes the trend.
Generating Buy Signals
1. Accumulation and Distribution Line Indicator
The accumulation distribution line indicator is a volume-based indicator formed by the relationship between the stock price and volume flow to determine the stock trend. The term “accumulation” refers to the level of buying (demand) of a stock, while “distribution” refers to the level of selling (supply). Thus, one can forecast a stock’s future price trend based on supply and demand pressures.
Accumulation means low-volume days followed by big price-high volume days, while distribution means high-volume days with no price move. The more accumulation, the more buying pressure on the stock, while the more distribution, the more sell-side pressure.
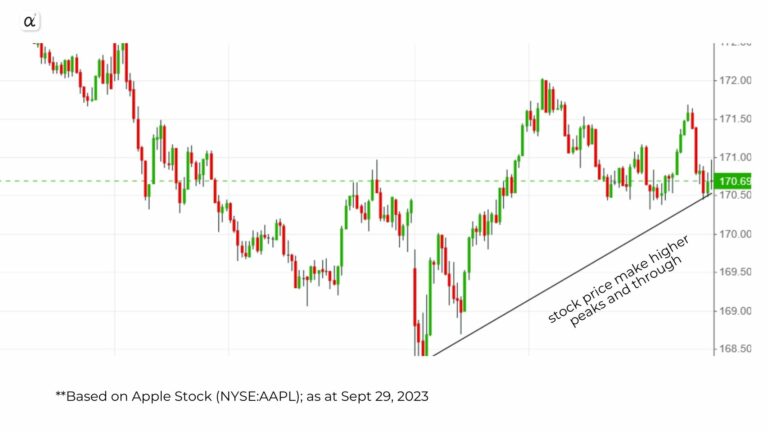
When both the indicator and stock price make higher peaks and through, the uptrend will likely continue.
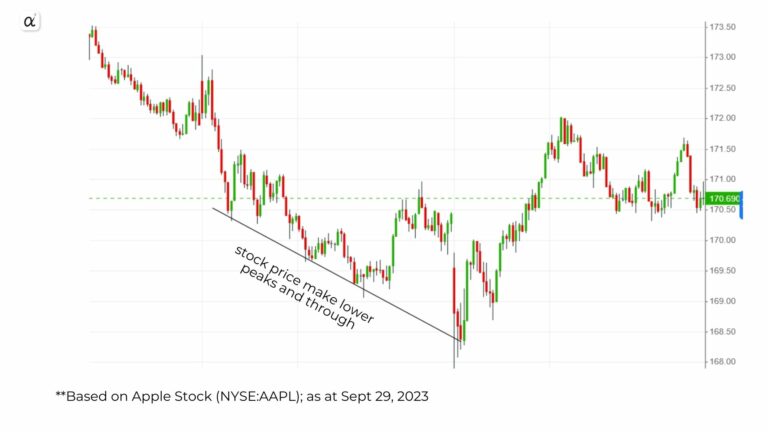
When both the indicator and stock price make lower peaks and through, we may see that the downtrend is going to continue.
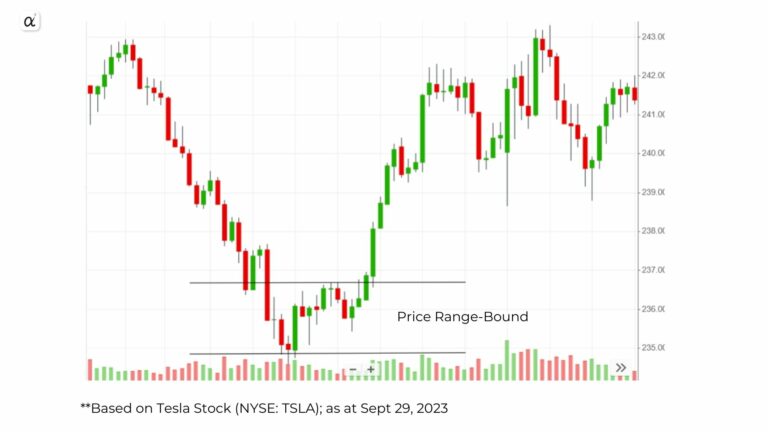
During the range-bound market, when the line starts decreasing, the stock may break out in the downward direction when there is distribution in the stock.
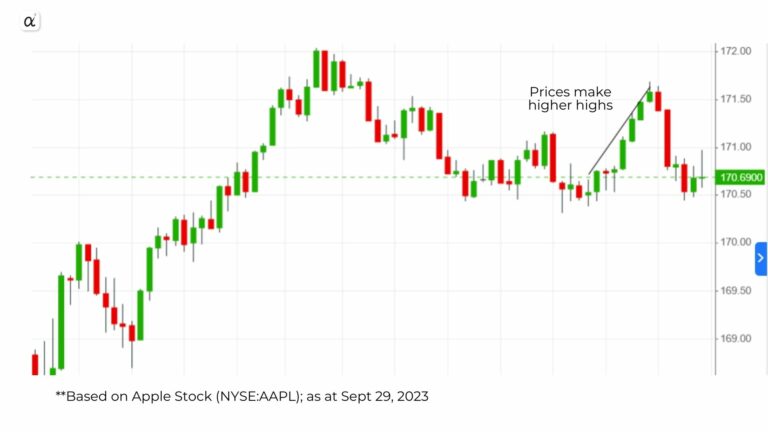
When the line makes lower highs, but prices make higher highs, then there may be a negative divergence, which the stock may reverse to a downtrend.
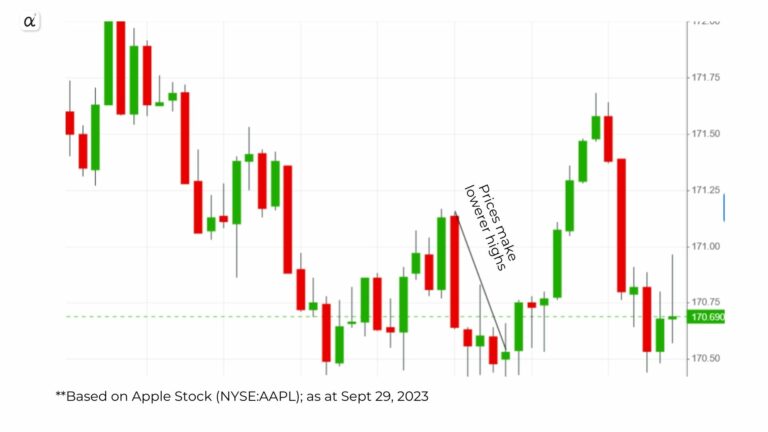
When the line makes higher highs, but prices make lower highs, then there may be a positive divergence, and the stock may reverse to an uptrend.
2. Bullish and Bearish Divergences: Volume indicators like the On-Balance-Volume (OBV)
The On Balance Volume (OBV) was one of the first technical indicators to measure positive and negative volume flow on a chart. It was created by Joe Granville and shared in his 1963 book “Granville’s New Key to Stock Market Profits.” Divergences between OBV and price action can be used by technical traders to project price movement probabilities or to confirm a trend.
OBV line on a chart is the running total of positive and negative volume. Whenever the close of a period is higher than the previous closing price, the volume is positive, and when it’s lower, the volume is negative. Using this method, we can see how volume changes in correlation with price action over any time frame.
OBV increases when volume on up days exceeds volume on down days. OBV decreases when down days have a higher volume. An ascending OBV shows positive volume pressure that can project higher prices. As an inverse, a descending OBV suggests lower prices through negative volume pressure.
Warning of Potential Trend Changes
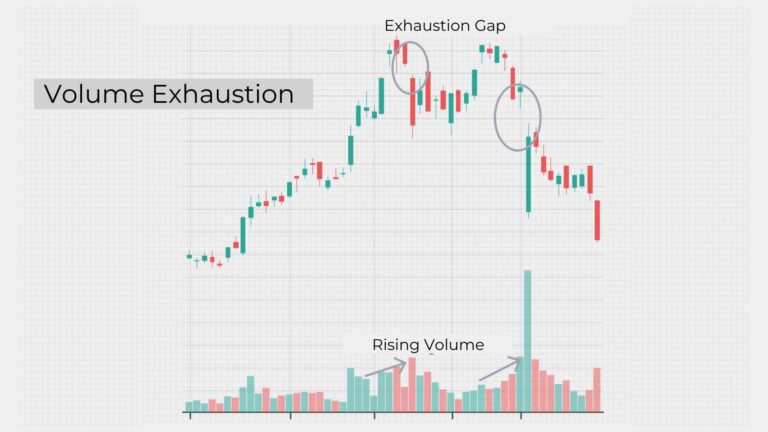
Extreme spikes in volume, often accompanied by rapid price movements, can indicate climactic conditions in the market. As the trend reaches these confluences, it may indicate an impending reversal or exhaustion.
Patterns such as the “Island Reversal” or “Volume Exhaustion” can serve as warning signs of trend reversals, especially when they coincide with other technical indicators.
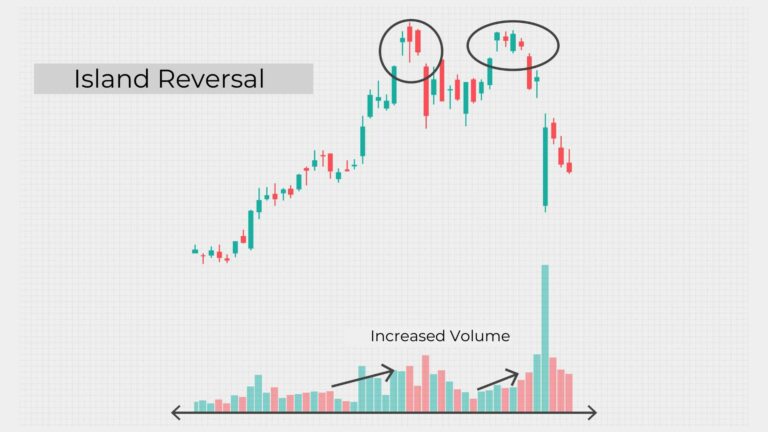
Tracking large trading volume
Large institutional investors, or “smart money,” often leave footprints in trading volume. Unusual spikes in volume can suggest institutional interest in a particular stock, which may be indicative of upcoming price movements. Another significant money movement is insider trading where their trading volume can also provide clues about insider trading activities. Unusual volume surges, especially when accompanied by significant price movements, may warrant investigation into insider trading.
Bottom Line
Understanding volume analysis in confirming trends, generating buy signals, warning of potential trend changes, and tracking smart money can help investors and traders make more informed decisions. By incorporating volume analysis into one’s trading strategy, one can better navigate the complex world of financial markets. Ultimately, volume analysis can be a powerful tool in a trader’s arsenal, if used properly.
The key takeaways/market update is a series by AxeHedge, which serves as an initiative to bring compact and informative In/Visible Talks recaps/takeaways on leading brands and investment events happening around the globe.
Do keep an eye out for our posts by subscribing to our channel and social media.
None of the material above or on our website is to be construed as a solicitation, recommendation or offer to buy or sell any security, financial product or instrument. Investors should carefully consider if the security and/or product is suitable for them in view of their entire investment portfolio. All investing involves risks, including the possible loss of money invested, and past performance does not guarantee future performance.
Trading Dow Pattern the Triangle Pattern (Part 1)
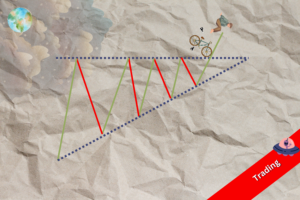
The first triangle: the Ascending Triangle
Read MoreFunds: Equity Funds (Part 3)
How to choose between equity funds based on companies’ earnings...
Read More
